. 2012 Jul;11(7):M112.017558.
doi: 10.1074/mcp.M112.017558. Epub 2012 Mar 28.

Metabolic flux increases glycoprotein sialylation: implications for cell adhesion and cancer metastasis

Affiliations

Metabolic flux increases glycoprotein sialylation: implications for cell adhesion and cancer metastasis

Ruben T Almaraz et al. Mol Cell Proteomics. 2012 Jul.

Abstract

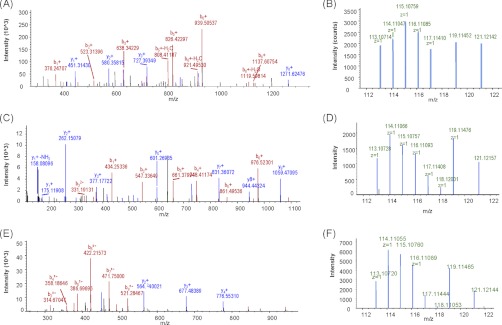
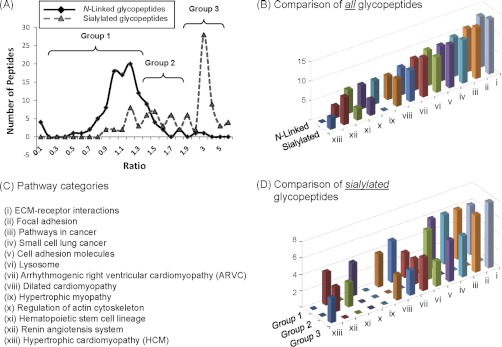
This study reports a global glycoproteomic analysis of pancreatic cancer cells that describes how flux through the sialic acid biosynthetic pathway selectively modulates a subset of N-glycosylation sites found within cellular proteins. These results provide evidence that sialoglycoprotein patterns are not determined exclusively by the transcription of biosynthetic enzymes or the availability of N-glycan sequons; instead, bulk metabolic flux through the sialic acid pathway has a remarkable ability to increase the abundance of certain sialoglycoproteins while having a minimal impact on others. Specifically, of 82 glycoproteins identified through a mass spectrometry and bioinformatics approach, ≈ 31% showed no change in sialylation, ≈ 29% exhibited a modest increase, whereas ≈ 40% experienced an increase of greater than twofold. Increased sialylation of specific glycoproteins resulted in changes to the adhesive properties of SW1990 pancreatic cancer cells (e.g. increased CD44-mediated adhesion to selectins under physiological flow and enhanced integrin-mediated cell mobility on collagen and fibronectin). These results indicate that cancer cells can become more aggressively malignant by controlling the sialylation of proteins implicated in metastatic transformation via metabolic flux.


Conflict of interest statement

CONFLICT OF INTEREST: The authors have no competing financial interests.

Figures

Fig. 1.
Fig. 1.
Overview of the sialic acid biosynthetic pathway and the selective sialylation of certain glycosites. A, Sialic acid biosynthesis begins with ManNAc, which is naturally supplied into the sialic acid biosynthetic pathway by conversion from UDP-GlcNAc by UDP-GlcNAc 2-epimerase (GNE). B, CMP-Neu5Ac produced from ManNAc is the substrate for a suite of sialyltransferases (STs) that install sialic acids into cell surface displayed protein- and lipid-bound glycoconjugates (in humans 20 STs exist that install either α2,3-, α2,6-, or α2,8-linked sialosides as described in detail elsewhere (44)). C, Using a “metabolic oligosaccharide engineering” approach (44, 45), increased flux was introduced into the pathway via 1,3,4-O-Bu3ManNAc (9). D, By increasing cellular levels of CMP-Neu5Ac, 1,3,4-O-Bu3ManNAc led to selectively enhanced sialylation of a subset of the glycans present on the cell surface; illustrative examples are provided by one of the potential N-glycans of CD44 (highlighted) and two of integrin α6 (please see references (–19), Table I, and Fig. 7 for additional details).
Fig. 2.
Fig. 2.
Changes in intracellular and surface sialic acid in 1,3,4-O-Bu3ManNAc-treated SW1990 cells. A, Total (which includes all forms of sialic acid found within a cell, black bars) and “glycoconjugate-bound” (which also includes soluble CMP-sialic acid, white bars) sialic acid was measured by using the periodate resorcinol assay in cells incubated with the indicated concentrations of 1,3,4-O-Bu3ManNAc for 2 days. Cells treated with 100 μm 1,3,4-O-Bu3ManNAc for 2 days were analyzed by (B) lectin binding or (C) flow cytometry. In panels A, B, and C, the error bars represent the S.D. of three different experiments with representative flow cytometry data for lectins shown in (D) ricin agglutinin (RCA), (E) Sambucus nigra agglutinin (SNA), or (F) Macckia amurensis agglutinin (MAA) and for flow cytometry in (G) α-CD1, (H) α-CD15s (sLeX), and (I) sLeA.
Fig. 3.
Fig. 3.
The identification and quantification of CD44 and integrin α6 by mass spectrometry. Glycopeptides were isolated from 1,3,4-O-Bu3ManNAc-treated and control SW1990 cells and identified as described in detail in the main text; to illustrate the identification process two examples (CD44 and integrin α6) are shown here. A, The matched fragments of CD44; B, the spectrum of iTRAQ reporter for CD44; C, the matched fragments of integrin α6 peptide, eINSLnLTESHnSR; D, the spectrum of iTRAQ reporter for integrin α6 peptide, eINSLnLTESHnSR; E, the matched fragments of integrin α6 peptide, anHSGAVVLLk; F, the spectrum of iTRAQ reporter for integrin α6 peptide, anHSGAVVLLk (amino acids indicated in lowercase at both ends of the sequence represent the iTRAQ labeled N termini and Lys; lowercase n in the nXT/S motif represents the formerly glycosylated Asp and deaminated after PNGase F release).
Fig. 4.
Fig. 4.
Comparisons of changes to total N-glycans or sialoglycopeptides isolated and identified from SW1990 cells. A, Changes in the ratios of peptides captured by the total glycan or sialic acid specific methods from 1,3,4-O-Bu3ManNAc-treated and control cells (the ratio shown on the x axis represent the quantitative proportion of peptide isolated from analog treated to control cells, determined as shown in Fig. 3 for CD44 and integrin α6). B, Pathway classes of proteins represented by both of the classes of glycopeptides (e.g. analog-treated and control) shown in (A); the classes i to xiii are listed in (C). Because virtually all of the proteins identified from the total N-linked glycans fell within one S.D. of the mean (i.e. between 0.73 and 1.41) in a bell shaped distribution, pathway analysis was performed only for the entire group. D, Additional pathway analysis, however, was conducted for the sialoglycoproteins based on the groups of sialopeptides shown in A: specifically, Group 1 included proteins that fell within one S.D. of the mean; Group 2 included proteins that experienced a modest but statistically significant increase in sialylation upon analog treatment; and Group 3 included proteins with sialylation increases of greater than ∼twofold.
Fig. 5.
Fig. 5.
Selectin-mediated adhesion under flow. SW1990 cell rolling velocities on immobilized E-selectin (A) and L-selectin (B) after treatment with 100 μm 1,3,4-O-Bu3ManNAc for 2 days before perfusion through an in vitro flow chamber at the physiologic shear rate of 0.5 dyne/cm2 (p values are shown for n ≥ 3 independent experiments in comparison to untreated control samples). Verification that protein levels of CD44 did not change by (C) flow cytometry and (D) Western blot analysis. E, Selectin-dependent adhesion to SDS-PAGE resolved and blotted CD44 immunoprecipitated from 1,3,4-O-Bu3ManNAc-treated (or untreated control) SW1990 cells. CHO-E cells, or CHO-P cells were perfused at the wall shear stress level of 0.5 dynes/cm2 over SDS-PAGE immunoblots of immunopurified CD44. F, SPR sensorgram of the interaction between CD44 from 1,3,4-O-Bu3ManNAc treated and nontreated SW1990 cells and immobilized selectins.
Fig. 6.
Fig. 6.
Wound healing, cell migration assays. SW1990 cells were treated (or not) with 100 μm 1,3,4-O-Bu3ManNAc (Cpd 1) and plated on culture plates pretreated with 20 μg/ml (A) collagen I, (B) fibronectin, or (C) BSA. After 24 h, wounds were created and new media without FBS but with (or without) fresh 1 was added. For each condition, 10 μg/ml of the integrin α6 functional blocking antibody (GoH3) was added to adjacent wells. The mobility of analog-treated cells was evaluated in comparison with control cells that had not been treated with analog by measuring the accumulated distance traveled per hour with the data given as a fold increase of analog-treated cells compared with control samples. D, Verification that protein levels of integrin α6 did not change was obtained by flow cytometry.
Fig. 7.
Fig. 7.
Representation of the identified glycopeptides aFnSTLPTmAQmEk in CD44 and eINSLnLTESHnSR and anHSGAVVLk in integrin α6. A, A cartoon representation of CD44 is shown with blue lollipops illustrating the positions of putative N-linked glycans. Successive “zoomed in” depictions show the location of the aFnSTLPTmZQEk glycopeptide within a computationally generated surface illustration of the HA binding domain of CD44. B, A cartoon representation of the integrin α6β1 complex (bottom) employs blue lollipops to illustrate the positions of putative N-linked glycans except for the red and green lollipops, which represent the actual N-glycans identified by mass spectrometry in this study. A modeled depiction of the integrin propeller subunit repeat containing the anHSGAVVLk glycopeptide is shown along with a zoomed in view of this glycopeptide with a representative N-glycan attached and shown using a sticks format. The green lollipop in the Calf-2 region represents the eINSLnLTESHnSR glycopeptide that also experienced selectively enhanced sialylation; sufficient structural information, however, is not available to further model this site.

References

    1. Krambeck F. J., Bennun S. V., Narang S., Choi S., Yarema K. J., Betenbaugh M. J. (2009) A mathematical model to derive N-glycan structures and cellular enzyme activities from mass spectrometric data. Glycobiology 19, 1163–1175 - PMC - PubMed
    1. Monica T. J., Andersen D. C., Goochee C. F. (1997) A mathematical model of sialylation of N-linked oligosaccharides in the trans-Golgi network. Glycobiology 7, 515–521 - PubMed
    1. Lau K. S., Partridge E. A., Grigorian A., Silvescu C. I., Reinhold V. N., Demetriou M., Dennis J. W. (2007) Complex N-glycan number and degree of branching cooperate to regulate cell proliferation and differentiation. Cell 129, 123–134 - PubMed
    1. Lau K. S., Dennis J. W. (2008) N-Glycans in cancer progression. Glycobiology 18, 750–760 - PubMed
    1. Dennis J. W., Nabi I. R., Demetriou M. (2009) Metabolism, cell surface organization, and disease. Cell 139, 1229–1241 - PMC - PubMed

Publication types

MeSH terms