

Influence of Environmental Factors on Biotic Responses to Nutrient Enrichment in Agricultural Streams
- PMID: 22457568
- PMCID: PMC3307628
- DOI: 10.1111/j.1752-1688.2010.00430.x
Influence of Environmental Factors on Biotic Responses to Nutrient Enrichment in Agricultural Streams
Abstract
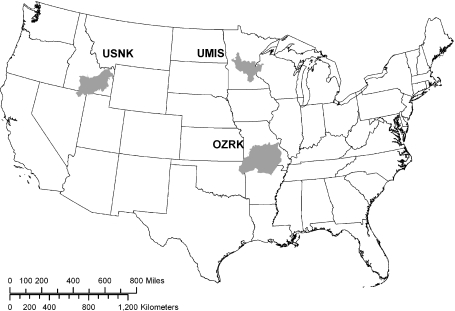
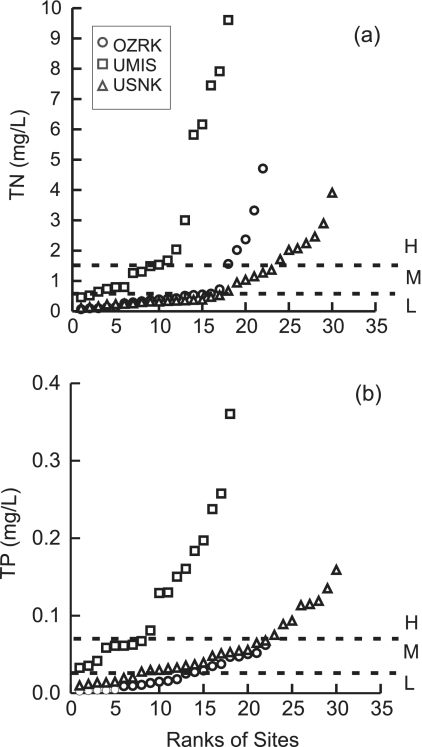
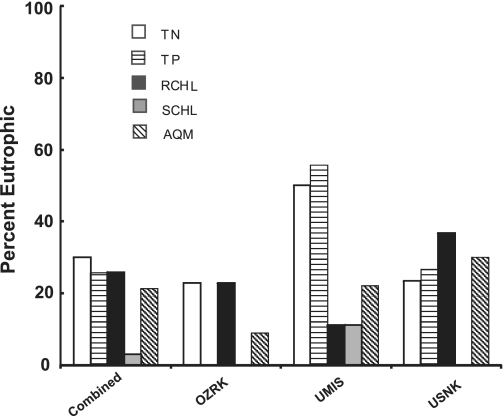
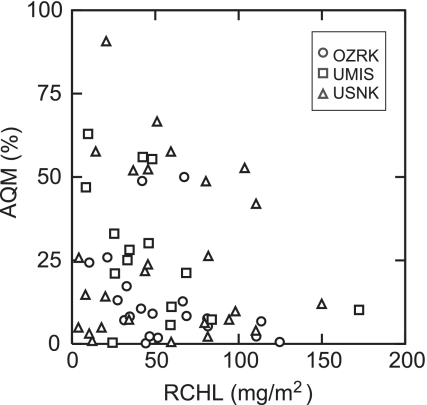
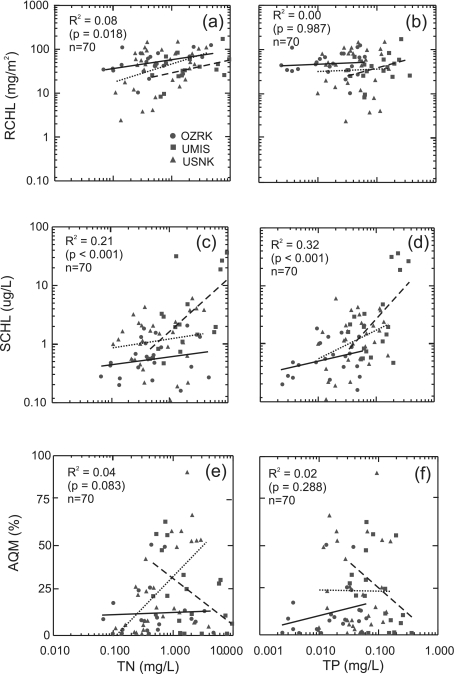
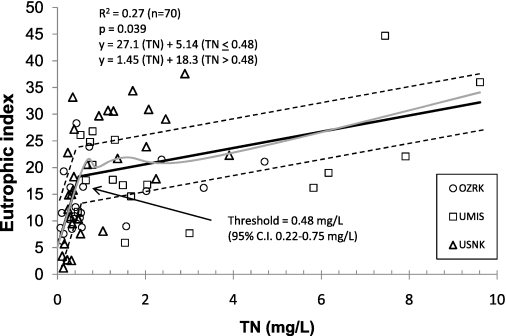
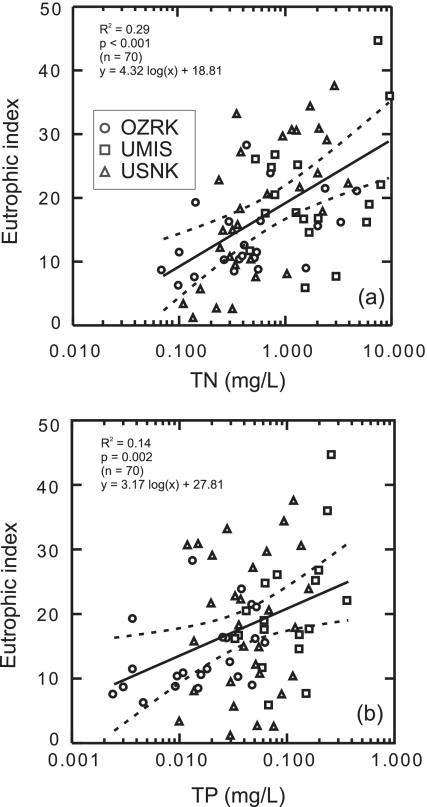
The influence of environmental factors on biotic responses to nutrients was examined in three diverse agricultural regions of the United States. Seventy wadeable sites were selected along an agricultural land use gradient while minimizing natural variation within each region. Nutrients, habitat, algae, macroinvertebrates, and macrophyte cover were sampled during a single summer low-flow period in 2006 or 2007. Continuous stream stage and water temperature were collected at each site for 30 days prior to sampling. Wide ranges of concentrations were found for total nitrogen (TN) (0.07-9.61 mg/l) and total phosphorus (TP) (<0.004-0.361 mg/l), but biotic responses including periphytic and sestonic chlorophyll a (RCHL and SCHL, respectively), and percent of stream bed with aquatic macrophyte (AQM) growth were not strongly related to concentrations of TN or TP. Pearson's coefficient of determination (R(2)) for nutrients and biotic measures across all sites ranged from 0.08 to 0.32 and generally were not higher within each region. The biotic measures (RCHL, SCHL, and AQM) were combined in an index to evaluate eutrophic status across sites that could have different biotic responses to nutrient enrichment. Stepwise multiple regression identified TN, percent canopy, median riffle depth, and daily percent change in stage as significant factors for the eutrophic index (R(2) = 0.50, p < 0.001). A TN threshold of 0.48 mg/l was identified where eutrophic index scores became less responsive to increasing TN concentrations, for all sites. Multiple plant growth indicators should be used when evaluating eutrophication, especially when streams contain an abundance of macrophytes.
Figures
References
-
- Allan JD. Stream Ecology: Structure and Function of Running Waters. Dordrect, The Netherlands: Kluwer Academic Publishers; 1995.
-
- Arar EJ, Colling GB. U.S. Environmental Protection Agency Method 445.0, In Vitro Determination of Chlorophyll a and Pheophytin a in Marine and Freshwater Algae by Fluorescence, Revision 1.2. Cincinnati, Ohio: U.S. Environmental Protection Agency, National Exposure Research Laboratory, Office of Research and Development; 1997. http://www.epa.gov/microbes/m445_0.pdf, accessed February 2010.
-
- Biggs BJF. The Contribution of Flood Disturbance, Catchment Geology, and Land Use to the Habitat Template of Periphyton in Stream Ecosystems. Freshwater Biology. 1995;33:419–438.
-
- Biggs BJF. Patterns in Benthic Algae in Streams. In: Stevenson JR, Bothwell ML, Lowe RL, editors. Algal Ecology: Freshwater Benthic Ecosystems. San Diego: Academic Press; 1996a. pp. 31–76.
-
- Biggs BJF. Hydraulic Habitat of Plants in Streams. Regulated Rivers: Research and Management. 1996b;12:131–144.
LinkOut - more resources
Full Text Sources