

Dynamic effective connectivity of inter-areal brain circuits
- PMID: 22457614
- PMCID: PMC3310731
- DOI: 10.1371/journal.pcbi.1002438
Dynamic effective connectivity of inter-areal brain circuits
Abstract
Anatomic connections between brain areas affect information flow between neuronal circuits and the synchronization of neuronal activity. However, such structural connectivity does not coincide with effective connectivity (or, more precisely, causal connectivity), related to the elusive question "Which areas cause the present activity of which others?". Effective connectivity is directed and depends flexibly on contexts and tasks. Here we show that dynamic effective connectivity can emerge from transitions in the collective organization of coherent neural activity. Integrating simulation and semi-analytic approaches, we study mesoscale network motifs of interacting cortical areas, modeled as large random networks of spiking neurons or as simple rate units. Through a causal analysis of time-series of model neural activity, we show that different dynamical states generated by a same structural connectivity motif correspond to distinct effective connectivity motifs. Such effective motifs can display a dominant directionality, due to spontaneous symmetry breaking and effective entrainment between local brain rhythms, although all connections in the considered structural motifs are reciprocal. We show then that transitions between effective connectivity configurations (like, for instance, reversal in the direction of inter-areal interactions) can be triggered reliably by brief perturbation inputs, properly timed with respect to an ongoing local oscillation, without the need for plastic synaptic changes. Finally, we analyze how the information encoded in spiking patterns of a local neuronal population is propagated across a fixed structural connectivity motif, demonstrating that changes in the active effective connectivity regulate both the efficiency and the directionality of information transfer. Previous studies stressed the role played by coherent oscillations in establishing efficient communication between distant areas. Going beyond these early proposals, we advance here that dynamic interactions between brain rhythms provide as well the basis for the self-organized control of this "communication-through-coherence", making thus possible a fast "on-demand" reconfiguration of global information routing modalities.
Conflict of interest statement
The authors have declared that no competing interests exist.
Figures

 ). Individual neurons spike irregularly (see the spike trains of eight representative neurons, top right), but the activity of the network undergoes a collective fast oscillation, visible in the average membrane potential (see example “LFP” trace, bottom right). B: in the rate model, each local area is modeled by a single mean-field rate unit with delayed local inhibition (of strength
  ). Its dynamics, describing the average area activity, also undergoes a fast oscillation (see example rate trace, right). C–D: the interaction between multiple local areas (
 in the case of the reported graphical illustrations, green and orange shading indicate separate areas) is modeled by the dynamics: of multiple local spiking networks, mutually interconnected by long-range excitatory synapses (see panel C); or of multiple rate units, coupled reciprocally by delayed excitation (of strength
  , see panel D).
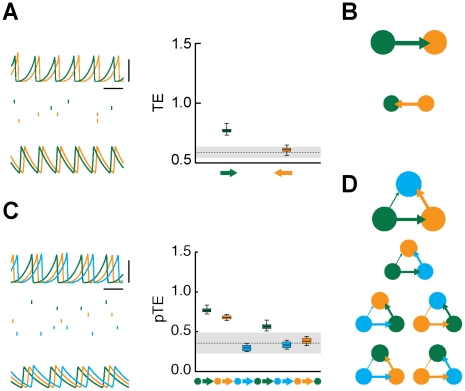
 (panels A–B) or
  (panels C–D) areas. A: the dynamics of
  interacting areas (green and orange colors) is illustrated by “LFPs” (left, top row) and representative spike trains (left, middle row, two cells per each area) from the network model (horizontal bar is
  , vertical bar is
  ), as well as by matching rate traces (left, bottom row) from the rate model (arbitrary time units). The right sub-panel reports the associated effective connectivity measured by Transfer Entropy (TE), evaluated from “LFPs” time-series, for all possible directed interactions (indicated by colored arrows). Boxes indicate the interquartile range and whiskers the confidence interval for the estimated TEs. TEs above the grey horizontal band indicate statistically significant causal influences (see
Methods
). B: to the right of the corresponding box-plot, effective connectivity is also represented in a diagrammatic form. Arrow thicknesses encode the strength of corresponding causal interactions (if statistically significant). Below this effective motif, a second motif in the same unidirectional driving family is plotted (with a smaller size), corresponding to another motif version with equivalent overall topology but reversed directionality. The parameters used for
), as well as by matching rate traces (left, bottom row) from the rate model (arbitrary time units). The right sub-panel reports the associated effective connectivity measured by Transfer Entropy (TE), evaluated from “LFPs” time-series, for all possible directed interactions (indicated by colored arrows). Boxes indicate the interquartile range and whiskers the confidence interval for the estimated TEs. TEs above the grey horizontal band indicate statistically significant causal influences (see
Methods
). B: to the right of the corresponding box-plot, effective connectivity is also represented in a diagrammatic form. Arrow thicknesses encode the strength of corresponding causal interactions (if statistically significant). Below this effective motif, a second motif in the same unidirectional driving family is plotted (with a smaller size), corresponding to another motif version with equivalent overall topology but reversed directionality. The parameters used for  are, for the network model:
  ,
,  ; and for the rate model:
  ,
,  ,
,  . C: this panels reports similar quantities as panel A, but now for a structural motif with
  areas (green, orange and light blue colors). Effective connectivity is now measured by partialized Transfer Entropy (pTE; see
Methods
), in order to account only for direct causal interactions. D: the six effective motifs of the unidirectional driving family for
areas (green, orange and light blue colors). Effective connectivity is now measured by partialized Transfer Entropy (pTE; see
Methods
), in order to account only for direct causal interactions. D: the six effective motifs of the unidirectional driving family for  are also reported. The parameters used for
  are, for the network model:
  ,
,  ; and for the rate model:
  ,
,  ,
,  .
.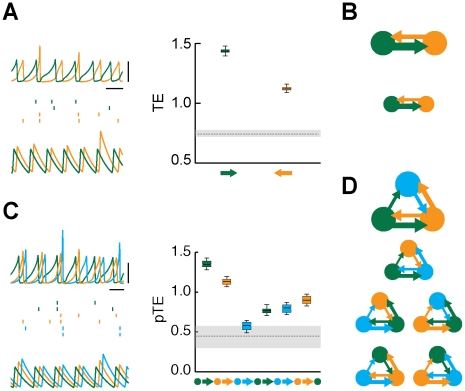
 (panels A–B) or
  (panels C–D) areas, for intermediate inter-areal coupling strength, leading to asymmetrically irregular oscillations, phase-locked with an average out-of-phase relation. A: the dynamics of
  interacting areas (green and orange colors) is illustrated by “LFPs” (left, top row) and representative spike trains (left, middle row, two cells per each area) from the network model (horizontal bar is
  , vertical bar is
  ), as well as by matching rate traces (left, bottom row) from the rate model (arbitrary time units). The right sub-panel reports the associated effective connectivity measured by Transfer Entropy (TE), evaluated from “LFPs” time-series, for all possible directed interactions (indicated by colored arrows). Boxes indicate the interquartile range and whiskers the confidence interval for the estimated TEs. TEs above the grey horizontal band indicate statistically significant causal influences (see
Methods
). B: to the right of the corresponding box-plot, effective connectivity is also represented in a diagrammatic form. Arrow thicknesses encode the strength of corresponding causal interactions (if statistically significant). Below this effective motif, a second motif in the same unidirectional driving family is plotted (with a smaller size), corresponding to another motif version with equivalent overall topology but reversed directionality. The parameters used for
), as well as by matching rate traces (left, bottom row) from the rate model (arbitrary time units). The right sub-panel reports the associated effective connectivity measured by Transfer Entropy (TE), evaluated from “LFPs” time-series, for all possible directed interactions (indicated by colored arrows). Boxes indicate the interquartile range and whiskers the confidence interval for the estimated TEs. TEs above the grey horizontal band indicate statistically significant causal influences (see
Methods
). B: to the right of the corresponding box-plot, effective connectivity is also represented in a diagrammatic form. Arrow thicknesses encode the strength of corresponding causal interactions (if statistically significant). Below this effective motif, a second motif in the same unidirectional driving family is plotted (with a smaller size), corresponding to another motif version with equivalent overall topology but reversed directionality. The parameters used for  are, for the network model:
  ,
,  ; and for the rate model:
  ,
,  ,
,  . C: this panels reports similar quantities as panel A, but now for a structural motif with
  areas (green, orange and light blue colors). Effective connectivity is measured by partialized Transfer Entropy (pTE; see
Methods
), in order to account for direct but not for indirect causal interactions. D: the six effective motifs of the unidirectional driving family for
areas (green, orange and light blue colors). Effective connectivity is measured by partialized Transfer Entropy (pTE; see
Methods
), in order to account for direct but not for indirect causal interactions. D: the six effective motifs of the unidirectional driving family for  are also reported. The parameters used for
  are, for the network model:
  ,
,  ; and for the rate model:
  ,
,  ,
,  .
.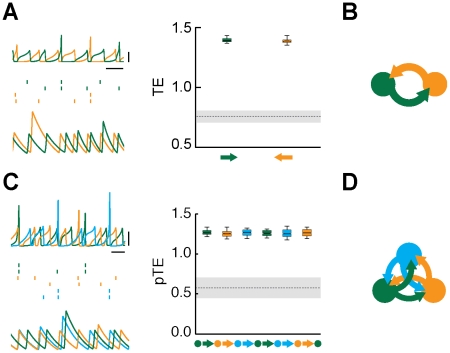
 (panels A–B) or
  (panels C–D) areas, for large inter-areal coupling strength, leading to symmetrically irregular oscillations, without a stable phase relation. A: the dynamics of
  interacting areas (green and orange colors) is illustrated by “LFPs” (left, top row) and representative spike trains (left, middle row, two cells per each area) from the network model (horizontal bar is
  , vertical bar is
  ), as well as by matching rate traces (left, bottom row) from the rate model (arbitrary time units). The right sub-panel reports the associated effective connectivity measured by Transfer Entropy (TE), evaluated from “LFPs” time-series, for all possible directed interactions (indicated by colored arrows). Boxes indicate the interquartile range and whiskers the confidence interval for the estimated TEs. TEs above the grey horizontal band indicate statistically significant causal influences (see
Methods
). B: to the right of the corresponding box-plot, effective connectivity is also represented in a diagrammatic form. Arrow thicknesses encode the strength of corresponding causal interactions (if statistically significant). A single motif is included in this family The parameters used for
), as well as by matching rate traces (left, bottom row) from the rate model (arbitrary time units). The right sub-panel reports the associated effective connectivity measured by Transfer Entropy (TE), evaluated from “LFPs” time-series, for all possible directed interactions (indicated by colored arrows). Boxes indicate the interquartile range and whiskers the confidence interval for the estimated TEs. TEs above the grey horizontal band indicate statistically significant causal influences (see
Methods
). B: to the right of the corresponding box-plot, effective connectivity is also represented in a diagrammatic form. Arrow thicknesses encode the strength of corresponding causal interactions (if statistically significant). A single motif is included in this family The parameters used for  are, for the network model:
  ,
,  ; and for the rate model:
  ,
,  ,
,  . C: this panels reports similar quantities as panel A, but now for a structural motif with
  areas (green, orange and light blue colors). Effective connectivity is measured by partialized Transfer Entropy (pTE; see
Methods
), in order to account for direct but not for indirect causal interactions. D: the mutual driving effective motif for
areas (green, orange and light blue colors). Effective connectivity is measured by partialized Transfer Entropy (pTE; see
Methods
), in order to account for direct but not for indirect causal interactions. D: the mutual driving effective motif for  is also reported. The parameters used for
  are, for the network model:
  ,
,  ; and for the rate model:
  ,
,  ,
,  .
.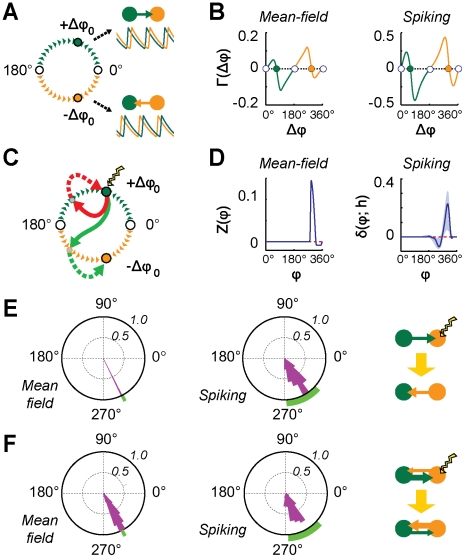
 ). Empty circles stand for unstable in- and anti-phase lockings and filled circles for stable out-of-phase lockings (corresponding to unidirectional driving effective motifs). B: phase-shift evolution function
  for the rate model (left, analytical solution,
  ) and for the network model (right, numerical evaluation,
  ). Empty and filled circles denote the same stable and unstable phase-lockings as in panel A. C: cartoon of successful (dashed green arrow) and unsuccessful (dashed grey arrow) switchings induced by brief perturbations (lightning icon). An input pulse to the system destabilizes transiently the current phase-locking (solid red and green arrows). For most perturbations, the system does not leave the current basin of attraction and the previous effective motif is restored (dashed red arrow). However, suitable perturbations can lead the system to switch to a different effective motif (dashed green arrow). D: a pulse of strength
  induces a phase advancement of the collective oscillations, depending on its application phase
  , as described by the Phase Response Curve
  (left, rate model; analytical solution,
  ) or by the induced shift
  (right, network model; numerical evaluation,
  ). E–F: frequency histogram of successful switching for pulses applied at different phases (the laggard area is perturbed;
  for the rate model and
  for the network model). Predicted intervals for successful switching are marked in green, for the unidirectional (panel E) and for the leaky effective driving (panel F) motifs (left, rate model; right, network model; parameters as in Figures 3 and 4). Diagrams of the induced transitions are shown in the third column (see SI, Figure S2 for perturbations applied to the leader area).
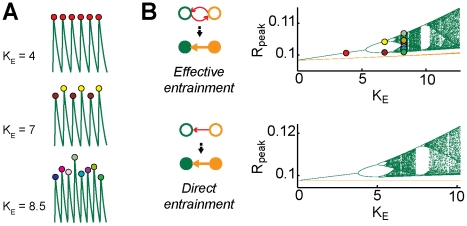
 ,
,  , from bottom to top). Filled circles denote peaks of oscillation cycles, different color fillings denote different peak amplitudes. B: The oscillatory dynamics is qualitatively altered by increasing inter-areal coupling, as visualized by bifurcation diagrams, constructed by plotting different peak amplitudes at constant
  , as different dots (the dots corresponding to the peak amplitudes in panel A, are highlighted also here by filled circles of matching colors). Varying
  in a continuous range, these dots trace a complex branched structure, denoting emergence of novel dynamical states. The bifurcation diagrams for the case of two symmetrically connected areas (top) and two unidirectionally connected areas (bottom) are very similar. For a symmetric structural motif, spontaneous symmetry breaking leads to effective entrainment, mimicking the direct entrainment, which occurs for an asymmetric unidirectional structural motif. Leader and laggard areas in effective entrainment behave similarly to the driver and driven area in direct entrainment (orange and green bifurcation diagrams, respectively). Note that different structural motifs give rise to equivalent effective motifs (see side diagrams). Note: a different version of panel B was previously published in as Supplementary Figure F.
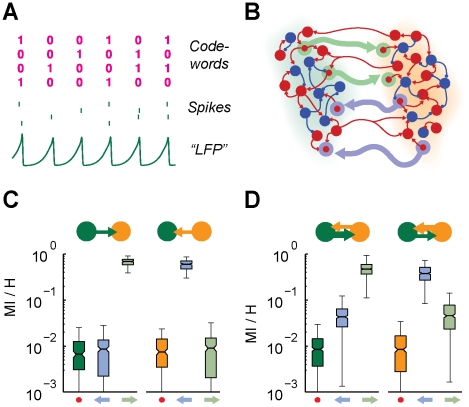
 symmetric structural motif (see
Methods
). Cells and synapses belonging to TLs are highlighted by pale green (“green-to-orange” area direction) and lilac (“orange-to-green” area direction) colors. Communication efficiency along TLs is quantified by the Mutual Information (
symmetric structural motif (see
Methods
). Cells and synapses belonging to TLs are highlighted by pale green (“green-to-orange” area direction) and lilac (“orange-to-green” area direction) colors. Communication efficiency along TLs is quantified by the Mutual Information ( ) between spike trains of pairs of source and target cells connected directly by a TL synapse, normalized by the entropy (
 ) of the source cell. C–D: boxplots (see Figures 3, 4 and 5) of
  for different groups of interconnected cells and for different active effective motifs. Pale green and lilac arrows below the boxplots indicate pairs of cells interconnected by the TL marked with the corresponding color. A dot indicates control pairs of cells interconnected by ordinary weak long-range synapses. Green and orange arrows indicate the dominant directionality of the active effective connectivity motif. C: unidirectional driving effective motif family. Communication efficiency is enhanced only along the TL aligned to the directionality of the active effective connectivity, while it is undistinguishable from control along the other TL. D: leaky driving effective motif family. Communication efficiency is enhanced along both TLs, but more along the TL aligned to the dominant directionality of the active effective connectivity.
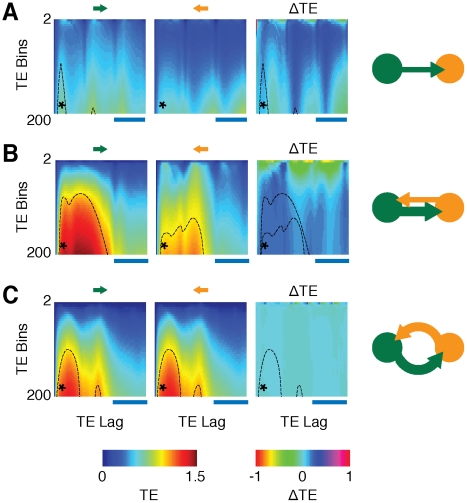
 fully symmetric structural motif, cfr. Figures 3, 4 and 5) on the number
  of discretization bins used to describe the time-series of neural activity and on the adopted time lag
  between the time-series (see
Methods
). The matrices in the first two columns (from the left) report TEs in the two possible interaction directions,
between the time-series (see
Methods
). The matrices in the first two columns (from the left) report TEs in the two possible interaction directions,  and
and  , and the matrices in the third column visualize the causal unbalancing
  (
( ), which quantifies the asymmetry between causal influences in the two directions (see
Methods
). All of these quantities are evaluated for different combinations of
), which quantifies the asymmetry between causal influences in the two directions (see
Methods
). All of these quantities are evaluated for different combinations of  and
and  . The vertical axes of the matrices correspond to the range
  bins and the horizontal axes to the range
  . This range of time lags corresponds approximately to three oscillation periods. Horizontal scale lines indicate the average oscillation period (
 , respectively for panels A, B and C). Values of TE and
  are color-coded (see color bars at the bottom, note the two different color scales for TE and
  ). Black dotted lines in the matrices enclose regions in which
  or
or  rise above the threshold for significancy of the corresponding causal interaction (see
Methods
). These significance contours are overlayed in the corresponding
rise above the threshold for significancy of the corresponding causal interaction (see
Methods
). These significance contours are overlayed in the corresponding  matrix. A star denotes the combination of
  and
and  used for the analysis throughout the main article (
 ,
,  ). Different rows report TE matrices for different effective motifs. A: unidirectional driving effective motif. B: leaky driving effective motif. C: mutual driving effective motif. Diagrams of these effective motifs are drawn in the fourth column as a visual reference. All other parameters are as for the analyses of Figures 3, 4 and 5.
References
-
- Fairhall SL, Ishai A. Effective Connectivity within the Distributed Cortical Network for Face Perception. Cereb Cort. 2007;17:2400–2406. - PubMed
-
- Steeves JK, Culham JC, Duchaine BC, Pratesi CC, Valyear KF, et al. The fusiform face area is not sufficient for face recognition: Evidence from a patient with dense prosopagnosia and no occipital face area. Neuropsychol. 2006;44:594–609. - PubMed
Publication types
MeSH terms
LinkOut - more resources
Full Text Sources
