. 2012;8(3):e1002561.
doi: 10.1371/journal.pgen.1002561. Epub 2012 Mar 22.

The Min system and nucleoid occlusion are not required for identifying the division site in Bacillus subtilis but ensure its efficient utilization

Affiliations

The Min system and nucleoid occlusion are not required for identifying the division site in Bacillus subtilis but ensure its efficient utilization

Christopher D A Rodrigues et al. PLoS Genet. 2012.

Abstract

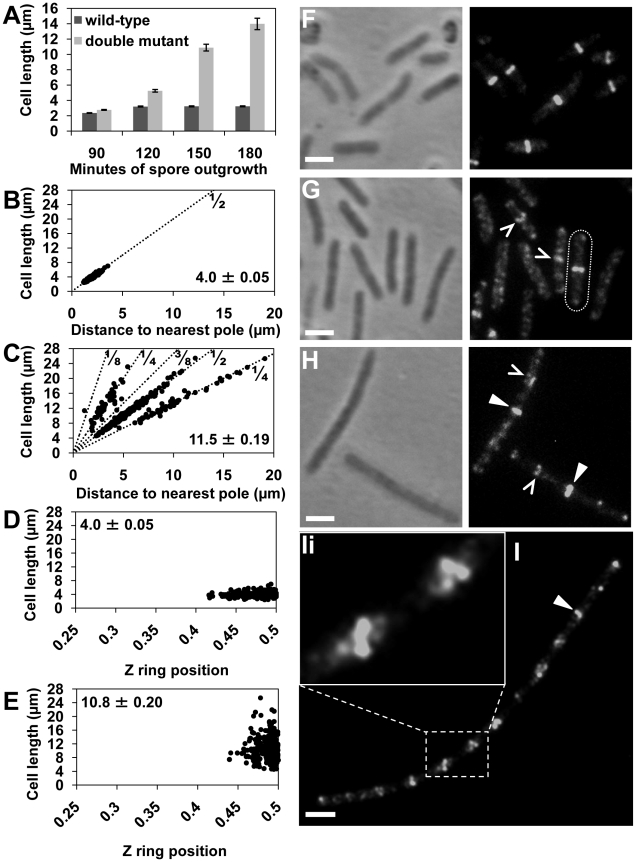
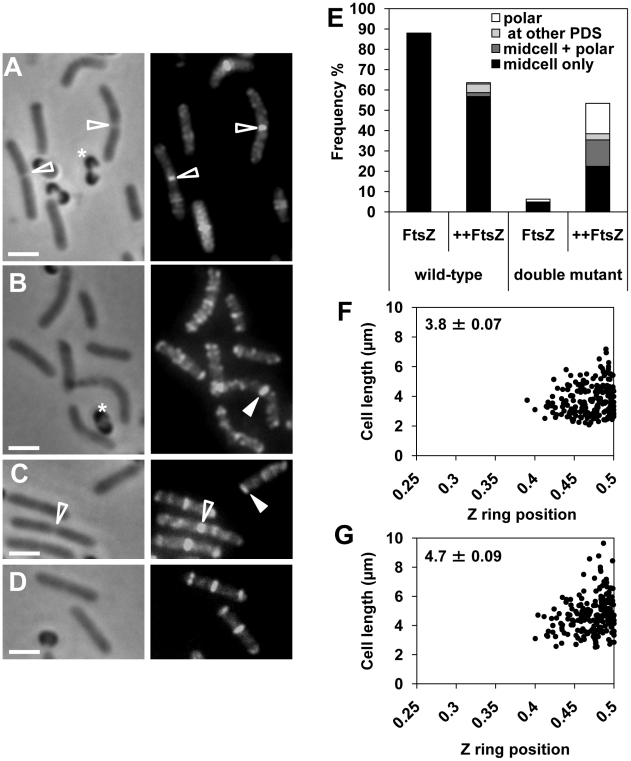
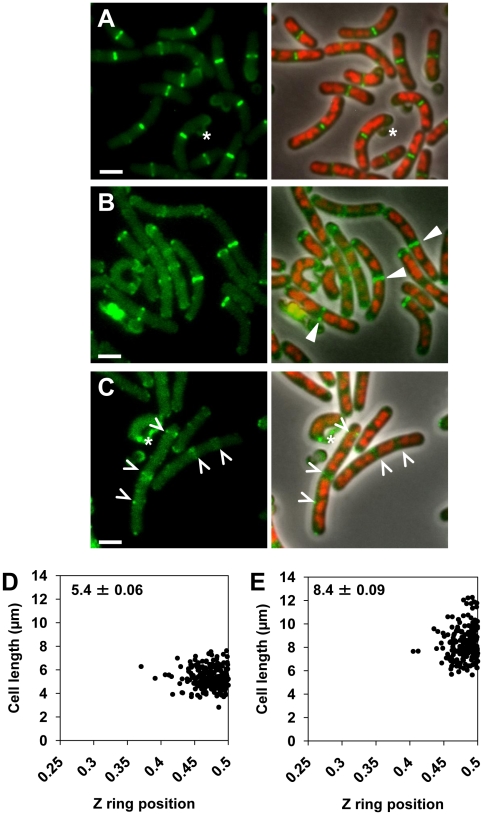
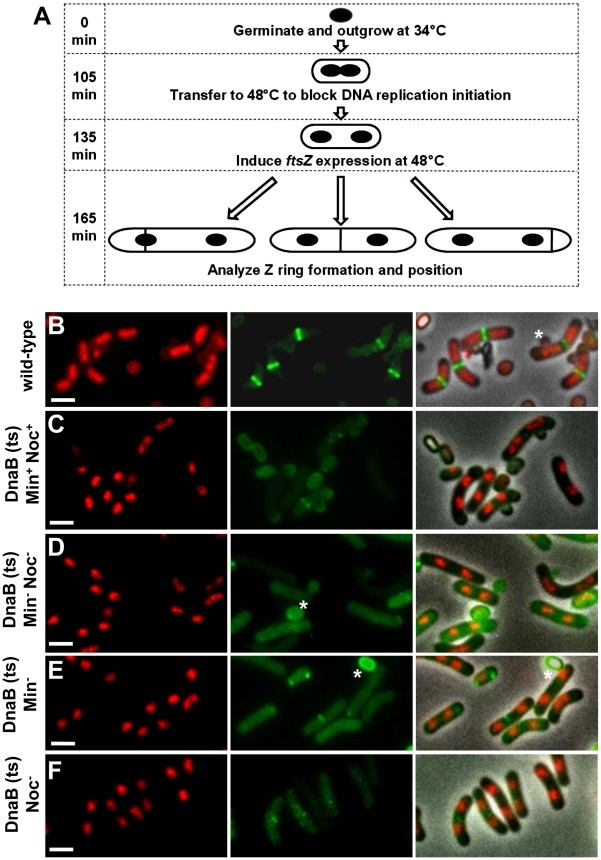
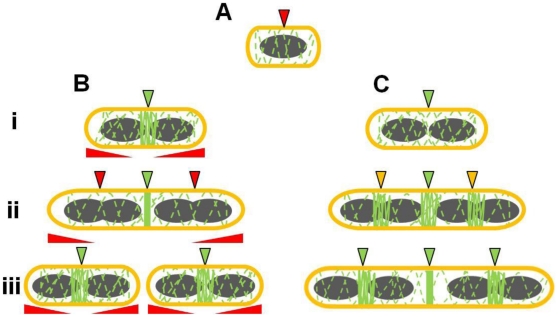
Precise temporal and spatial control of cell division is essential for progeny survival. The current general view is that precise positioning of the division site at midcell in rod-shaped bacteria is a result of the combined action of the Min system and nucleoid (chromosome) occlusion. Both systems prevent assembly of the cytokinetic Z ring at inappropriate places in the cell, restricting Z rings to the correct site at midcell. Here we show that in the bacterium Bacillus subtilis Z rings are positioned precisely at midcell in the complete absence of both these systems, revealing the existence of a mechanism independent of Min and nucleoid occlusion that identifies midcell in this organism. We further show that Z ring assembly at midcell is delayed in the absence of Min and Noc proteins, while at the same time FtsZ accumulates at other potential division sites. This suggests that a major role for Min and Noc is to ensure efficient utilization of the midcell division site by preventing Z ring assembly at potential division sites, including the cell poles. Our data lead us to propose a model in which spatial regulation of division in B. subtilis involves identification of the division site at midcell that requires Min and nucleoid occlusion to ensure efficient Z ring assembly there and only there, at the right time in the cell cycle.


Conflict of interest statement

The authors have declared that no competing interests exist.

Figures

Figure 1
Figure 1. Z rings form precisely at midcell in the noc minCD double mutant.
Spores of the double-mutant (SU681) and wild-type (SU5) strain were germinated in PAB at 34°C. Cells were fixed in ethanol or prepared for immunofluorescence to visualize FtsZ. (A) Mean length of the wild-type and double-mutant outgrown cells collected at 90, 120, 150 and 180 min after spore germination and prepared for ethanol-fixation. Error bars are µm ± SEM. (B and C) Z ring position plotted in relation to the predicted position of potential division sites (dotted lines; 1/2, 1/4, 1/8, 3/8) in the wild-type (B) and double mutant (C) strains at 150 min of spore outgrowth. Bottom-left corner shows the mean cell length of the cells plotted (µm ± SEM). (D and E) Z ring position at the first (medial) division site in the wild-type (D) and the double-mutant (E) cells at 120 min and 150 min of spore outgrowth, respectively. Top left-hand corner shows the average cell length of the cells plotted (µm ± SEM). (F and G) FtsZ localization in wild-type (F) and double-mutant (G) at 120 min of spore outgrowth. Cell containing a midcell Z ring in the double-mutant strains is outlined. (H and I) FtsZ localization in the double-mutant at 150 min (H) and at 180 min (I) of spore outgrowth. (Ii) Amplification of the white rectangle in (I) showing helical-like patterns of FtsZ. Carets point to accumulations of FtsZ at division sites and triangles point to Z rings in the double mutant. Images are phase contrast (left), and FtsZ immunofluorescence (right). Scale bars are 2 µm.
Figure 2
Figure 2. FtsZ overproduction reduces the delay in Z ring assembly at midcell in the noc minCD double mutant.
Spores of double-mutant (SU685) and the wild-type (SU558) strains, containing Pspachy-ftsZ integrated at amyE, were outgrown at 34°C in PAB with 0.05 mM IPTG or without IPTG and collected at 120 min for visualization of FtsZ using immunofluorescence microscopy. (A to D) FtsZ localization in wild-type cells germinated with IPTG at 120 min (A), in the double-mutant without IPTG at 120 min (B), and in the double-mutant with IPTG at 120 min (C and D). Images are phase-contrast (left), and FtsZ immunofluorescence (right). Open triangles point to constricting Z rings and closed triangles point to examples of Z rings. Stars denote spore coats. Scale bars are 2 µm. (E) Frequency of outgrown spores that contain Z rings for the wild-type and double-mutant strains. Z ring frequencies are shown in the presence (++FtsZ) or absence (FtsZ) of IPTG (n>400). The height of the bar shows the total frequency of cells with Z rings. Each bar is divided into percentages of cells with a single midcell Z ring (midcell only, black bar), cells with more than one Z ring (midcell+polar, dark grey bar), a single Z ring located at a future (potential) division site (PDS, light grey bar) and a single polar Z ring (polar, white bar). Average cell lengths of the whole population in the wild-type background were 2.8±0.05 (µm ± SEM) with IPTG (++FtsZ) and 2.6±0.06 without IPTG (FtsZ); and in the double-mutant background were 3.1±0.07 with IPTG (++FtsZ) and 3.3±0.07 without IPTG (FtsZ). (F and G) Z ring positioning at the first (medial) division site in the wild-type (F) and double-mutant (G) outgrown spores overproducing FtsZ. Top left-hand corner denotes the average cell length of the cells plotted (µm ± SEM).
Figure 3
Figure 3. Midcell Z rings form precisely between replicating nucleoids in the noc minCD double mutant.
Spores of wild-type (SU492) and double-mutant (SU663) strains, both containing Pxyl-ftsZ-yfp integrated at the amyE locus, were outgrown at 34°C in PAB with 0.5% xylose and collected for live cell analysis at 120 min of outgrowth. (A and B) Z ring localization in wild-type (A) and double-mutant (B) cells. (C) Accumulations of FtsZ present in the double-mutant cells. Images are FtsZ-YFP pseudo-coloured in green (left) and phase contrast overlay (right) of pseudo-coloured DAPI (red) and pseudo-coloured FtsZ-YFP (green). Carets point to accumulations of FtsZ and white triangles point to Z rings between nucleoids. Stars denote fluorescent spore coats. Scale bars are 2 µm. (D and E) Z ring positioning at the first (medial) division site in the wild-type background (D) and double-mutant (E) outgrown spores, both overproducing FtsZ-YFP. Top left-hand corner denotes the average cell length of cells plotted (µm ± SEM).
Figure 4
Figure 4. Experimental approach and separation of nucleoids after one round of replication, prior to production of FtsZ.
(A) Diagram of experimental approach (see Materials and Methods for complete details). Spores of the dnaB (ts) strains containing Pspac-ftsZ and Pxyl-ftsZ-yfp [strains SU671 (Min+, Noc+), SU678 (Min), SU680 (Min, Noc), and SU683 (Noc)] were germinated in GMD at 34°C and then transferred to 48°C to prevent re-initiation of DNA replication and allow separation of replicated nucleoids. IPTG (1 mM) and xylose (0.01%) were then added. Cells were removed and prepared for live visualization of Z rings and nucleoids. (B) Representative images of Z rings and nucleoids in the wild-type control strain SU492 (DnaB+). Spores of this strain were germinated in GMD with 0.01% xylose at 34°C for 105 min, transferred to 48°C for 30 min and then collected for analysis. These conditions differ from that of the test strains to allow visualization of Z rings in the first round of replication. (C to F) Representative images of cells of the dnaB (ts) strains containing two separated nucleoids, collected prior to induction of ftsZ expression with IPTG, when both MinCD and Noc are present (C), when both MinCD and Noc are absent (D), when MinCD is absent (E), when Noc is absent (F). Images are DAPI (nucleoid) pseudo-coloured in red (left), FtsZ-YFP pseudo-coloured in green (middle) and phase-contrast fluorescence overlay (right). Stars denote autofluorescent spore coats. Scale bars are 2 µm.
Figure 5
Figure 5. Separation of nucleoids and Z ring positioning in outgrown spores of dnaB (ts) strains.
Refer to Figure 4A for experimental design. (A) Separation of nucleoids in cells collected at 135 min after the start of germination, prior to induction of ftsZ expression. Columns read left to right; e.g. DnaB (ts), Min+Noc+: the mean cell length of the population was 3.8 µm; 43% of the population contained two separated nuceloids; cells with two nucleoids had a mean length of 4.0 µm; the mean internucleoid distance in cells with two nucleoids was 0.77 µm. (B) Z ring assembly and positioning in cells collected at 165 min after the start of germination, 30 min after induction of ftsZ expression. Columns read left to right: e.g. DnaB (ts), Min+Noc+: the mean cell length of the population was 6.8 µm; Z rings were present in 66% of cells, out of which 56% had one Z ring and two nucleoids. Of these cells with two nucleoids, 94% had a Z ring between two nucleoids and 6% had a Z ring between the nucleoid and the pole. SEM is standard error of the mean.
Figure 6
Figure 6. Z ring formation and positioning in cells with two separated nucleoids.
(A) Co-visualization of Z rings and nucleoids in the wild-type control strain SU492 (DnaB+). These cells were outgrown as for Figure 4B. (B to J) Representative image of cells of the dnaB (ts) strains containing two separated nucleoids after induction of ftsZ expression (see Figure 4A) when both MinCD and Noc are present (SU671) (B and C), when both MinCD and Noc are absent (SU680) (D to F), when MinCD is absent (SU678) (G and H) and when Noc is absent (SU683) (I and J). (B, D, E, G, I) show a Z ring between the two nucleoids; (C, F and H) show a Z ring between the pole and one of the nucleoids and (J) shows a Z ring over one of the nucleoids. For more examples of cells with two nucleoids and a single Z ring refer to Figures S6 and S7. Images are DAPI (nucleoid) pseudo-coloured in red (left), FtsZ-YFP pseudo-coloured in green (middle) and phase-contrast fluorescence overlay (right). Stars denote autofluorescent spore coats. Scale bars are 2 µm.
Figure 7
Figure 7. Z rings are positioned precisely between two separated nucleoids in the absence of Noc, Min, or both.
The approach for this experiment is illustrated in Figure 4A. Spores of the dnaB (ts) strains containing Pspac-ftsZ integrated at the ftsZ locus and Pxyl-ftsZ-yfp at the amyE locus [strains SU671 (Min+, Noc+), SU678 (Min), SU680 (Min, Noc), and SU683 (Noc)] were germinated as described in the legend of Figure 4A. (A to E) Scatter plots demonstrating Z ring precision relative to cell length in the wild-type control (DnaB+, SU492) (A), in dnaB ts cells when Noc and MinCD are present (SU671) (B), in dnaB ts cells when MinCD is absent (SU678) (C), in dnaB ts cells when Noc is absent (SU683) (D) and in dnaB ts cells when both Noc and MinCD are absent (SU680) (E). Top left hand corner in each graph shows mean cell length of cells plotted (µm ± SEM). Over 200 cells were scored in each case.
Figure 8
Figure 8. Midcell Z ring precision does not correlate with internucleoid distance.
Cells were prepared as described in Figure 4A. (A to E) Scatter plots, using the dnaB (ts) cells as for Figure 7, showing the Z ring location relative to internucleoid distance in the wild-type control (DnaB+, SU492) (A), in dnaB (ts) cells when Noc and MinCD are present (SU671) (B), when MinCD is absent (SU678) (C), when Noc is absent (SU683) (D) and when both Noc and MinCD are absent (SU680) (E). Top left hand corner shows mean internucleoid distance (µm ± SEM). Over 200 cells were scored in each case.
Figure 9
Figure 9. Model for the role of Noc and Min in ensuring efficient utilization of the division site in B. subtilis.
(A) Early in the cell cycle, possibly upon completion of the initiation phase of DNA replication (see Moriya et al, 2010) a midcell-defining factor marks the position of the future division site at which the Z ring will assemble. At this stage, midcell becomes competent for Z ring assembly. However the early utilization of this division site by the Z ring is blocked by nucleoid occlusion (demonstrated by the red arrow). (Bi) In wild-type cells, the midcell site becomes unmasked (in green) upon segregation of the bulk of the replicated chromosomes (shown in grey). This causes Noc and other nucleoid occlusion factors to clear the central region of the cell. (Bii) As the cells elongate, other division sites competent for Z ring assembly become available at the cell quarters. These sites are masked (in red) by the combined activity of Noc (and possibly other nucleoid occlusion factors), and Min that acts at a distance from the pole, allowing FtsZ to concentrate to the midcell division site only. The red elongated triangles below each cell correspond to the position and concentration of Min (higher at the poles). (Biii) The quarter (potential) division sites only become available after Z ring constriction is initiated at the first (midcell) site, allowing separated daughter cells to initiate a new division cycle. (Ci) In the absence of Noc and MinCD, despite midcell being competent for Z ring assembly, utilization of this site is delayed due to the titration of FtsZ to the cell poles, and the inability of FtsZ to reach a high enough threshold concentration at midcell to form a ring. (Cii) As the cells grow, FtsZ can eventually start to accumulate at midcell, but also at other division sites that would normally be blocked by Noc and MinCD (in yellow). (Ciii) Z ring assembly at the medial division site (midcell) occurs very late, well after wild-type cells would have already completed a round of division, causing a severe delay in cell division. The dashed green lines along the length of the cell indicate the constant dynamic movement of FtsZ throughout the cell.

References

    1. Harry E, Monahan L, Thompson L. Bacterial cell division: the mechanism and its precison. Int Rev Cytol. 2006;253:27–94. - PubMed
    1. Rothfield L, Taghbalout A, Shih YL. Spatial control of bacterial division-site placement. Nat Rev Microbiol. 2005;3:959–968. - PubMed
    1. Adams DW, Errington J. Bacterial cell division: assembly, maintenance and disassembly of the Z ring. Nat Rev Microbiol. 2009;7:642–653. - PubMed
    1. de Boer PA. Advances in understanding E. coli cell fission. Curr Opin Microbiol. 2010;13:730–737. - PMC - PubMed
    1. Mingorance J, Rivas G, Velez M, Gomez-Puertas P, Vicente M. Strong FtsZ is with the force: mechanisms to constrict bacteria. Trends Microbiol. 2010;18:348–356. - PubMed

Publication types

MeSH terms