Comparative Study
. 2012 Jun 15;444(3):561-71.
doi: 10.1042/BJ20120294.

Pyruvate fuels mitochondrial respiration and proliferation of breast cancer cells: effect of monocarboxylate transporter inhibition

Affiliations
Comparative Study

Pyruvate fuels mitochondrial respiration and proliferation of breast cancer cells: effect of monocarboxylate transporter inhibition

Anne R Diers et al. Biochem J. .

Abstract

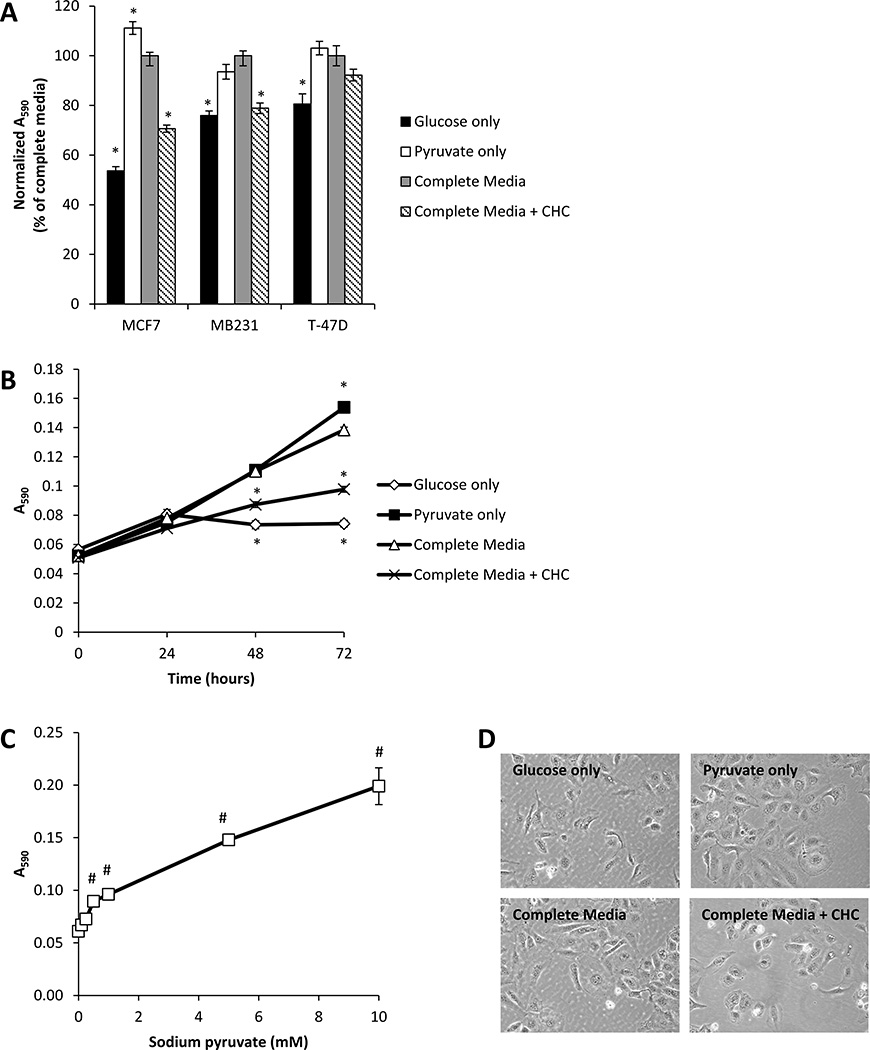
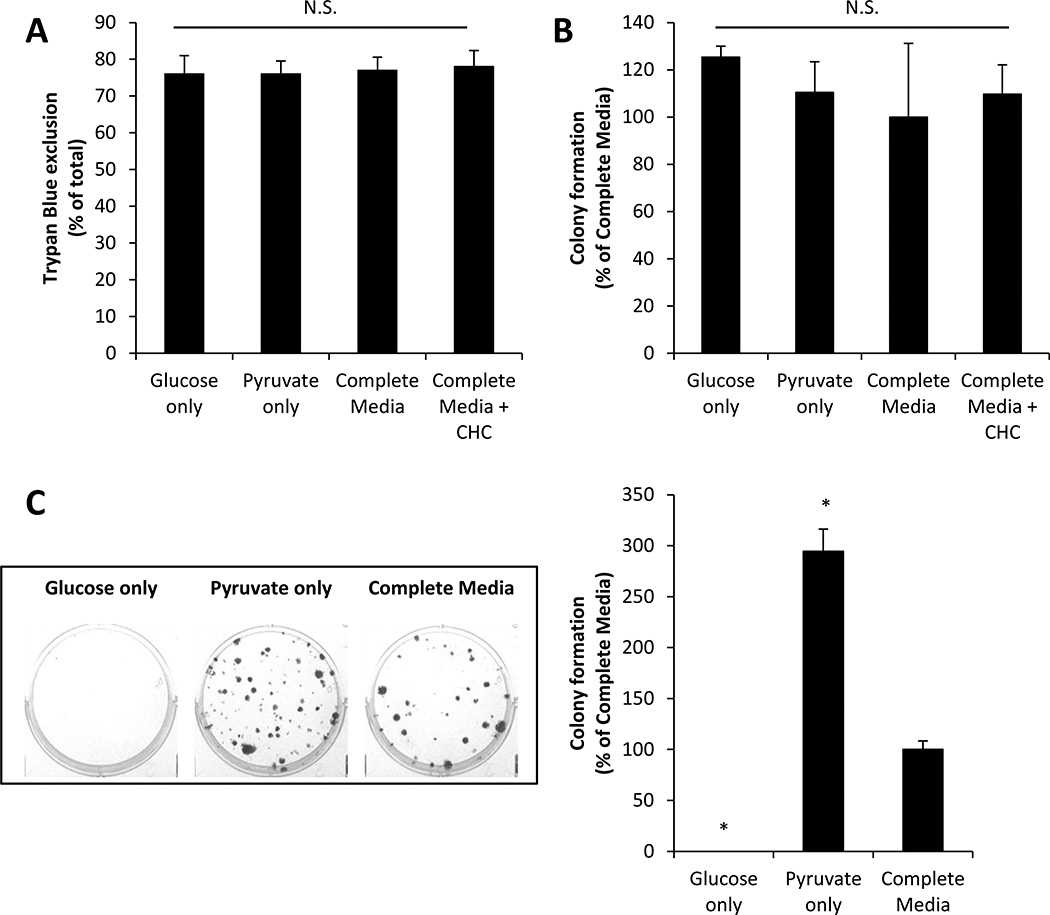
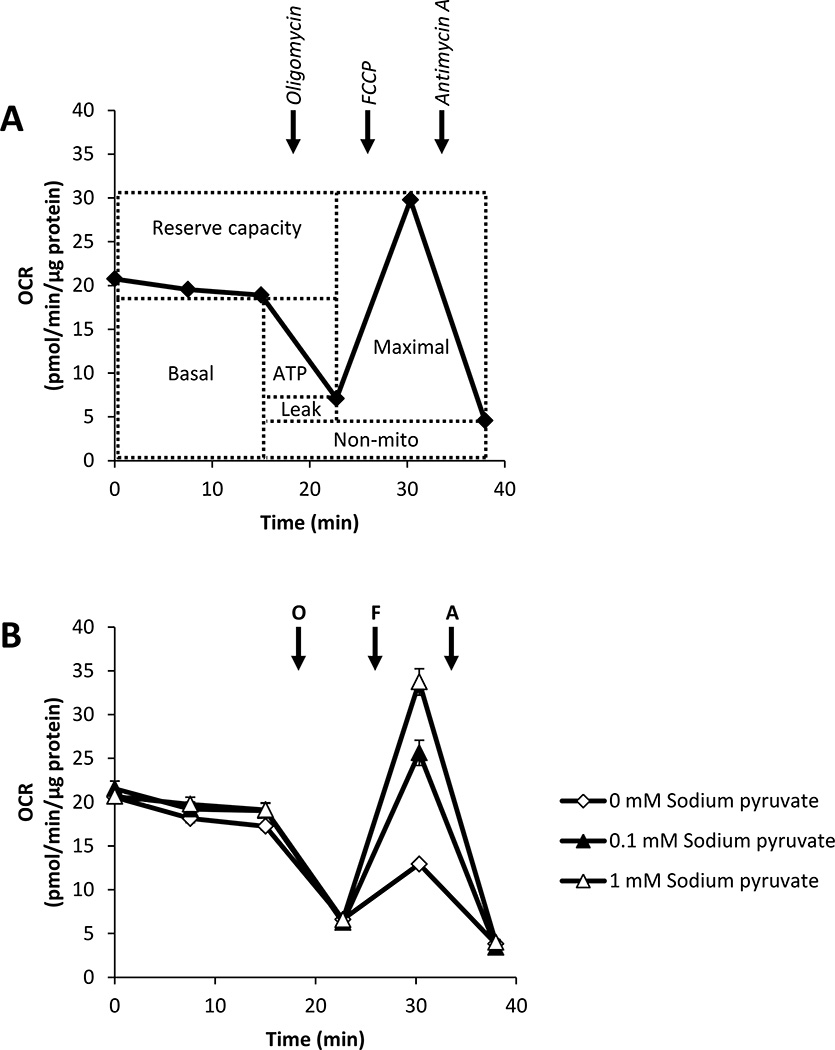
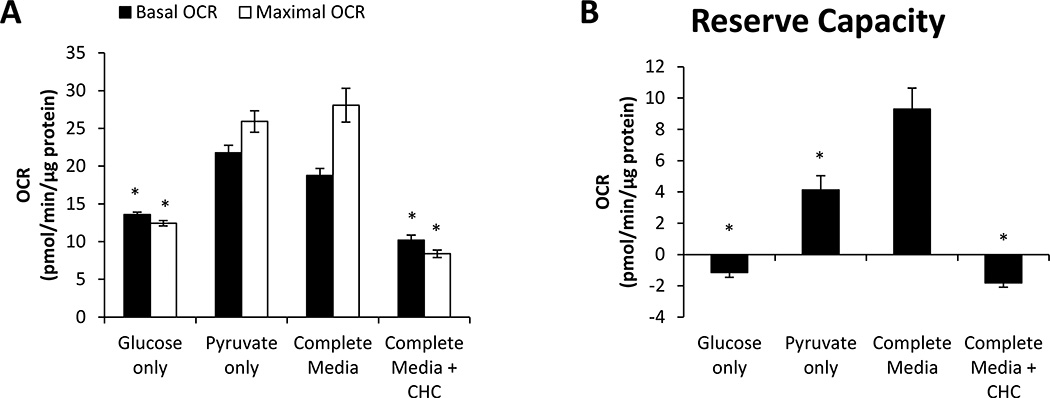
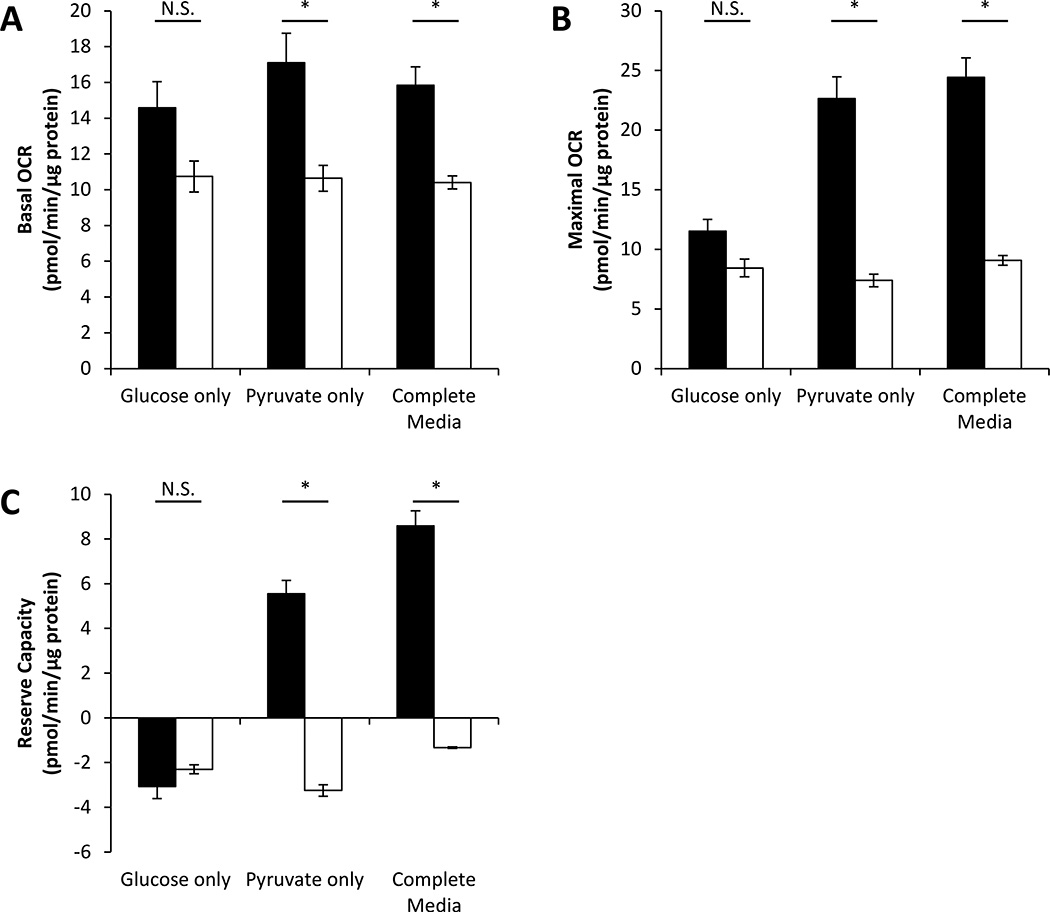
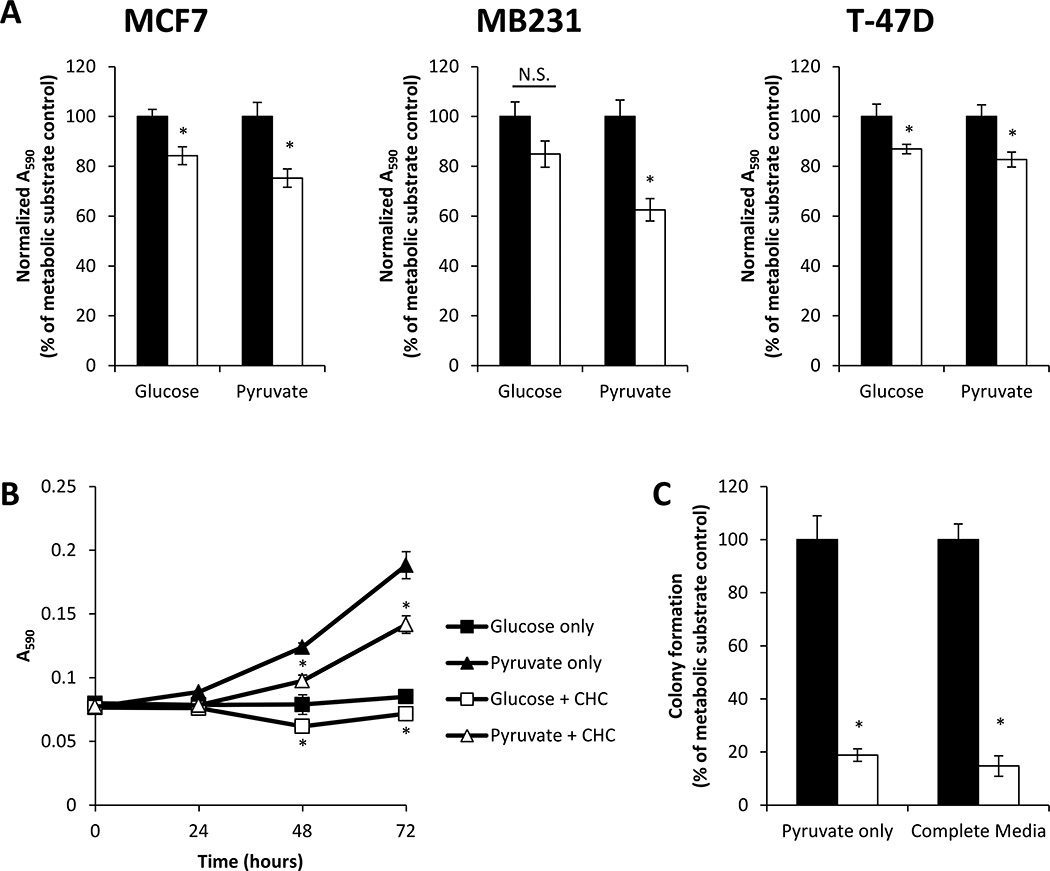
Recent studies have highlighted the fact that cancer cells have an altered metabolic phenotype, and this metabolic reprogramming is required to drive the biosynthesis pathways necessary for rapid replication and proliferation. Specifically, the importance of citric acid cycle-generated intermediates in the regulation of cancer cell proliferation has been recently appreciated. One function of MCTs (monocarboxylate transporters) is to transport the citric acid cycle substrate pyruvate across the plasma membrane and into mitochondria, and inhibition of MCTs has been proposed as a therapeutic strategy to target metabolic pathways in cancer. In the present paper, we examined the effect of different metabolic substrates (glucose and pyruvate) on mitochondrial function and proliferation in breast cancer cells. We demonstrated that cancer cells proliferate more rapidly in the presence of exogenous pyruvate when compared with lactate. Pyruvate supplementation fuelled mitochondrial oxygen consumption and the reserve respiratory capacity, and this increase in mitochondrial function correlated with proliferative potential. In addition, inhibition of cellular pyruvate uptake using the MCT inhibitor α-cyano-4-hydroxycinnamic acid impaired mitochondrial respiration and decreased cell growth. These data demonstrate the importance of mitochondrial metabolism in proliferative responses and highlight a novel mechanism of action for MCT inhibitors through suppression of pyruvate-fuelled mitochondrial respiration.


Conflict of interest statement

No conflicts of interest, financial or otherwise, are declared by the authors.

Figures

Figure 1
Figure 1. Effect of metabolic substrates on breast cancer cell proliferation
MCF7, MB231, and T-47D cells were cultured in media containing glucose only (5.56 mM), pyruvate only (1 mM), glucose and pyruvate (complete media), or complete media containing CHC (500 µM) for 72 h. Total cell number was then assessed using the MTT assay (A). MCF7 cells were exposed to the same media conditions for 24–72 h, and total cell number was assessed using the MTT assay (B). Media containing glucose (5.56 mM) and increasing concentrations of pyruvate (0.1–10 mM) were used to culture MCF7 cells for 72 h prior to assessment of total cell number (C). Light micrographs of cells cultured in media containing specified metabolic substrates for 72 h (D). Values represent means ± SEM, n = 6. * p < 0.05 compared to complete media. # p < 0.05 compared to 0 mM sodium pyruvate.
Figure 2
Figure 2. Effect of metabolic substrates on MCF7 cell viability and colony formation
MCF7 cells were cultured in media containing glucose only (5.56 mM), pyruvate only (1 mM), glucose and pyruvate (complete media), or complete media containing CHC (500 µM) for 48 h. The number of cells which exclude Trypan Blue (A) and colony formation (B) was quantified. MCF7 cells were also seeded at low density in media containing glucose only (5.56 mM), pyruvate only (1 mM), or glucose and pyruvate (complete media), and the number of colonies formed was measured. Representative images of the cloning wells and quantification are shown (C). Values represent means ± SEM, n = 6. * p < 0.05 compared to complete media. N.S. denotes no significant difference between groups.
Figure 3
Figure 3. Effects of CHC on metabolic substrate transport into cells
Cellular consumption of glucose (A) and pyruvate (B) from the media after exposure to increasing concentrations of CHC (50–500 µM) was determined in MCF7 cells. Lactate production from cells was assessed under the same experimental conditions (C). Glucose, pyruvate, and lactate levels in media were determined before and after 4 h incubation with cells. Values were normalized to total cell number/well and represent means ± SEM, n=3–5. * p < 0.05 compared to control. N.S. denotes no significant difference between groups.
Figure 4
Figure 4. Assessment of mitochondrial function using extracellular flux technology
A schematic representation of the mitochondrial function assay is shown in Panel A. After establishment of baseline oxygen consumption rate (OCR), sequential injection of oligomycin (O), FCCP (F), and Antimycin A (A) allows for the determination of multiple mitochondrial function parameters including basal OCR, maximal OCR, ATP-linked OCR (ATP), proton leak (leak), reserve capacity, and OCR independent of Complex IV (non-mito). MCF7 cells were seeded in specialized microplates and cultured for 24 h. Cells were then switched to unbuffered DMEM media supplemented with glucose (5.56 mM) and increasingly concentrations of pyruvate (0.1–5 mM) and mitochondrial function was assessed (B). OCRs were normalized to total protein/well after completion of assay, and representative OCR traces are shown. Values represent means ± SEM, n=3–5.
Figure 5
Figure 5. Regulation of mitochondrial function by pyruvate
MCF7 cells were seeded in specialized microplates and cultured for 24 h. Cells were then switched to unbuffered DMEM media supplemented with glucose (5.56 mM) and increasingly concentrations of pyruvate (0.1–5 mM) and mitochondrial function was assessed using sequential injection of oligomycin, FCCP, and Antimycin A. Basal and maximal oxygen consumption rate (OCR) (A), ATP-linked OCR (B), proton leak (C), reserve capacity (D), and non-mitochondrial OCR (E) are shown. Extracellular acidification rate (ECAR) was measured concomitantly (F). OCR and ECAR were normalized to total protein/well after completion of assay. Values represent means ± SEM, n=3–5. * p < 0.05 compared to 0 mM sodium pyruvate. N.S. denotes no significant difference between groups.
Figure 6
Figure 6. Regulation of mitochondrial function by metabolic substrate supply
MCF7 cells were seeded in specialized microplates and cultured for 24h. Cells were then switched to unbuffered DMEM containing glucose only (5.5.6 mM), pyruvate only (1 mM), glucose and pyruvate (complete media), or complete media with CHC (500 µM) 1 h prior to measuring mitochondrial function. Basal and maximal OCR (A) and the reserve capacity (B) were measured using sequential ingjection of oligomycin, FCCP, and Antimycin A. OCRs were normalized to total protein/well after completion of assay. Values represent means ± SEM, n=3–5. * p < 0.05 compared to complete media.
Figure 7
Figure 7. Effect of CHC on mitochondrial function in the presence of different metabolic substrates
MCF7 cells were seeded in specialized microplates and cultured for 24 h. 1 h prior to assessment of mitochondrial function, cells were switched to unbuffered DMEM containing glucose only (5.56 mM), pyruvate only (1 mM), or glucose and pyruvate (complete media) in the absence (closed bars) or presence (open bars) of CHC (500 µM). Basal oxygen consumption rate (OCR) (A), maximal OCR stimulated with 3 µM FCCP (B), and reserve capacity (C) were measured. OCRs were normalized to total protein/well after completion of assay. Values represent means ± SEM, n=3–4. * p < 0.05 compared to media condition without CHC. N.S. denotes no significant difference between groups.
Figure 8
Figure 8. Effect of CHC on cell proliferation in the presence of different metabolic substrates
MCF7, MB231, and T-47D cells were cultured in media containing glucose only (5.56 mM) or pyruvate only (1 mM) in the absence (closed bars) or presence (open bars) of CHC (500 µM) for 72 h. Total cell number was then assessed using the MTT assay (A). MCF7 cells were exposed to the same media conditions for 24–72 h, and total cell number was assessed using the MTT assay (B). MCF7 cells were seeded at low density in media containing glucose only (5.56 mM), pyruvate only (1 mM), or glucose and pyruvate (complete media) in the absence (closed bars) or presence (open bars) of CHC (500 µM), and the number of colonies formed was measured (C). Values represent means ± SEM, n = 3–6. * p < 0.05 compared to media condition without CHC. N.S. denotes no significant difference between groups.

References

    1. Brooks GA. Mammalian fuel utilization during sustained exercise. Comp Biochem.Physiol B Biochem.Mol.Biol. 1998;120:89–107. - PubMed
    1. Brooks GA. Cell-cell and intracellular lactate shuttles. J.Physiol. 2009;587:5591–5600. - PMC - PubMed
    1. Cairns RA, Harris IS, Mak TW. Regulation of cancer cell metabolism. Nat.Rev.Cancer. 2011;11:85–95. - PubMed
    1. Carpenter L, Halestrap AP. The kinetics, substrate and inhibitor specificity of the lactate transporter of Ehrlich-Lettre tumour cells studied with the intracellular pH indicator BCECF. Biochem.J. 1994;304(Pt 3):751–760. - PMC - PubMed
    1. Chen H, Wang L, Beretov J, Hao J, Xiao W, Li Y. Co-expression of CD147/EMMPRIN with monocarboxylate transporters and multiple drug resistance proteins is associated with epithelial ovarian cancer progression. Clin.Exp.Metastasis. 2010;27:557–569. - PubMed

Publication types

MeSH terms