. 2012 Mar 30:10:23.
doi: 10.1186/1477-5956-10-23.

A comparative proteomic study identified LRPPRC and MCM7 as putative actors in imatinib mesylate cross-resistance in Lucena cell line

Affiliations

A comparative proteomic study identified LRPPRC and MCM7 as putative actors in imatinib mesylate cross-resistance in Lucena cell line

Stephany Corrêa et al. Proteome Sci. .

Abstract

Background: Although chronic myeloid leukemia (CML) treatment has improved since the introduction of imatinib mesylate (IM), cases of resistance have been reported. This resistance has been associated with the emergence of multidrug resistance (MDR) phenotype, as a BCR-ABL independent mechanism. The classic pathway studied in MDR promotion is ATP-binding cassette (ABC) family transporters expression, but other mechanisms that drive drug resistance are largely unknown. To better understand IM therapy relapse due to the rise of MDR, we compared the proteomic profiles of K562 and Lucena (K562/VCR) cells.

Results: The use of 2-DE coupled with a MS approach resulted in the identification of 36 differentially expressed proteins. Differential mRNA levels of leucine-rich PPR motif-containing (LRPPRC) protein, minichromosome maintenance complex component 7 (MCM7) and ATP-binding cassette sub-family B (MDR/TAP) member 1 (ABCB1) were capable of defining samples from CML patients as responsive or resistant to therapy.

Conclusions: Through the data presented in this work, we show the relevance of MDR to IM therapy. In addition, our proteomic approach identified candidate actors involved in resistance, which could lead to additional information on BCR-ABL-independent molecular mechanisms.


Figures

Figure 1
Figure 1
ABCB1/Pgp expression levels in K562 and Lucena cells. (A) RT-qPCR analysis of ABCB1 mRNA levels. Raw expression values were normalized to β-actin expression. (B) Pgp expression by flow cytometry, represented as MRFI. (C) Representative histograms of Pgp expression. (1): K562 cells and (2): Lucena cells. PE-isotype antibody was used as control. Values represent the means of three independent determinations ± s.d (*p < 0.05)
Figure 2
Figure 2
Panel of Lucena cross-resistance to IM treatment. (A) K562 and Lucena cell lines were treated with a range of IM doses for 24 h. Cell viability was measured by trypan blue exclusion assay. Apoptotic cells (B) and cell cycle (C) were measured by flow cytometry after 1 μM of IM treatment in both cell lines. (D) ABCG2, OCT1 and BCR-ABL mRNA expression levels in K562 and Lucena cell lines were quantified by RT-qPCR. Expression values were normalized to β-actin expression. Values represent the means of three independent determinations ± s.d. (*p < 0.05; **p < 0.01; ***p < 0.001)
Figure 3
Figure 3
Lucena cells cross-resistance to IM is due Pgp efflux. Apoptotic cells (A), cell cycle (B) and Rho 123 (C-D) were measured by flow cytometry after 3 different treatments conditions: 1 μM IM, 50 μM VP and co-treatment with 1 μM IM and 50 μM VP. (D) Representative histograms of Rho 123 extrusion under conditions described above. (1): K562 ctrl and IM treatment; (2): Lucena ctrl and (3) Lucena under: IM, VP and IM + VP treatments. K562 cells were used as positive control for Rho 123 retention, and K562 treated with 1 μM IM was used as positive control for apoptosis induction and cell cycle arrest. Values represent the means of three independent determinations ± s.d. (*p < 0.05; **p < 0.01). AF = auto fluorescence; K5 = K562; LU = Lucena.
Figure 4
Figure 4
Proteome maps of K562 (A) and Lucena (B) cell lines. Nine hundred micrograms of total protein extract were separated by electrophoresis on IPG (pH 4-7) and gradient (8-18%) SDS-PAGE gels. 2-DE gels were stained with coomassie colloidal blue (CBB). The migration of molecular mass markers is represented in the middle. Numbers refer to the spot identity used in table 1. Arrows correspond to the differentially expressed proteins according to ImageMaster 2D Platinum software.
Figure 5
Figure 5
Network analysis of down-expressed proteins involved in resistance. The biological network was generated after the protein's dataset was uploaded into IPA. Gray nodes denote uploaded proteins, and white nodes denote proteins from the IPA database. Lines between the nodes indicate direct protein-protein interactions. Arrowheads show the direction of interaction. Self-regulation is indicated by lines that begin and end on the same node.
Figure 6
Figure 6
Network analysis of over-expressed proteins involved in resistance. The biological network was generated after the protein's dataset was uploaded into IPA. Gray nodes denote uploaded proteins, and white nodes denote proteins from the IPA database. Lines between the nodes indicate direct protein-protein interactions. Arrowheads show the direction of interaction. Self-regulation is indicated by lines that begin and end on the same node.
Figure 7
Figure 7
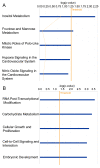
IPA analysis of proteins down-expressed in resistance. (A) Canonical Pathways analysis. The top 5 canonical pathways, are shown as determined by IPA. The y-axis shows the negative log of the p-value. (B) Biofunction analysis. The top 5 biofunctions among "Diseases and Disorders", "Molecular and Cellular Functions" and "Physiological System Development and Function" are shown as determined by IPA. The y-axis shows the negative log of the p-value.
Figure 8
Figure 8
IPA analysis of proteins over-expressed in resistance. (A) Canonical Pathways analysis. The top 5 canonical pathways, are shown as determined by IPA. The y-axis shows the negative log of the p-value. (B) Biofunction analysis. The top 5 biofunctions among "Diseases and Disorders", "Molecular and Cellular Functions" and "Physiological System Development and Function" are shown as determined by IPA. The y-axis shows the negative log of the p-value.
Figure 9
Figure 9
Real-time quantitative PCR analysis of target gene expression in healthy donors and CML patients. Total RNA was isolated from bone marrow donors and CML patients and examined by RT-qPCR to determine changes in mRNA levels. Raw expression values were normalized to β-actin expression. Analyses of ABCB1, ABCG2, OCT1, RBM17, LRPPRC and MCM7 expression changes were performed in 6 donors, 5 IM-responsive patients and 9 IM-resistant patients. Values represent the means of three independent determinations ± s.d. (*p < 0.05). Resp. P = responsive patients; Resist. P. = resistant patients.

References

    1. Jiang X, Zhao Y, Smith C, Gasparetto M, Turhan A, Eaves A, Eaves C. Chronic myeloid leukemia stem cells possess multiple unique features of resistance to BCR-ABL targeted therapies. Leukemia. 2007;21:926–935. - PubMed
    1. Hochhaus A. Chronic myelogenous leukemia (CML): resistance to tyrosine kinase inhibitors. Ann Oncol. 2006;17:274–279. doi: 10.1093/annonc/mdl273. - DOI - PubMed
    1. Mughal TI, Goldman JM. Emerging strategies for the treatment of mutant Bcr-Abl T315I myeloid leukemia. Clin Lymphoma Myeloma. 2007;7:S81–S84. doi: 10.3816/CLM.2007.s.006. - DOI - PubMed
    1. Quintás-Cardama A, Kantarjian HM, Cortes JE. Mechanisms of Primary and Secondary Resistance to Imatinib in Chronic Myeloid Leukemia. Cancer Control. 2009;16:122–131. - PubMed
    1. Walz C, Sattler M. Novel targeted therapies to overcome imatinib mesylate resistance in chronic myeloid leukemia. Crit Rev Oncol Hematol. 2006;57:145–164. doi: 10.1016/j.critrevonc.2005.06.007. - DOI - PubMed

LinkOut - more resources