Randomized Controlled Trial
. 2013 Jan;68(1):87-95.
doi: 10.1093/gerona/gls078. Epub 2012 Mar 28.

The safety, pharmacokinetics, and effects of LGD-4033, a novel nonsteroidal oral, selective androgen receptor modulator, in healthy young men

Affiliations
Randomized Controlled Trial

The safety, pharmacokinetics, and effects of LGD-4033, a novel nonsteroidal oral, selective androgen receptor modulator, in healthy young men

Shehzad Basaria et al. J Gerontol A Biol Sci Med Sci. 2013 Jan.

Abstract

Background: Concerns about potential adverse effects of testosterone on prostate have motivated the development of selective androgen receptor modulators that display tissue-selective activation of androgenic signaling. LGD-4033, a novel nonsteroidal, oral selective androgen receptor modulator, binds androgen receptor with high affinity and selectivity. Objectives. To evaluate the safety, tolerability, pharmacokinetics, and effects of ascending doses of LGD-4033 administered daily for 21 days on lean body mass, muscle strength, stair-climbing power, and sex hormones.

Methods: In this placebo-controlled study, 76 healthy men (21-50 years) were randomized to placebo or 0.1, 0.3, or 1.0 mg LGD-4033 daily for 21 days. Blood counts, chemistries, lipids, prostate-specific antigen, electrocardiogram, hormones, lean and fat mass, and muscle strength were measured during and for 5 weeks after intervention.

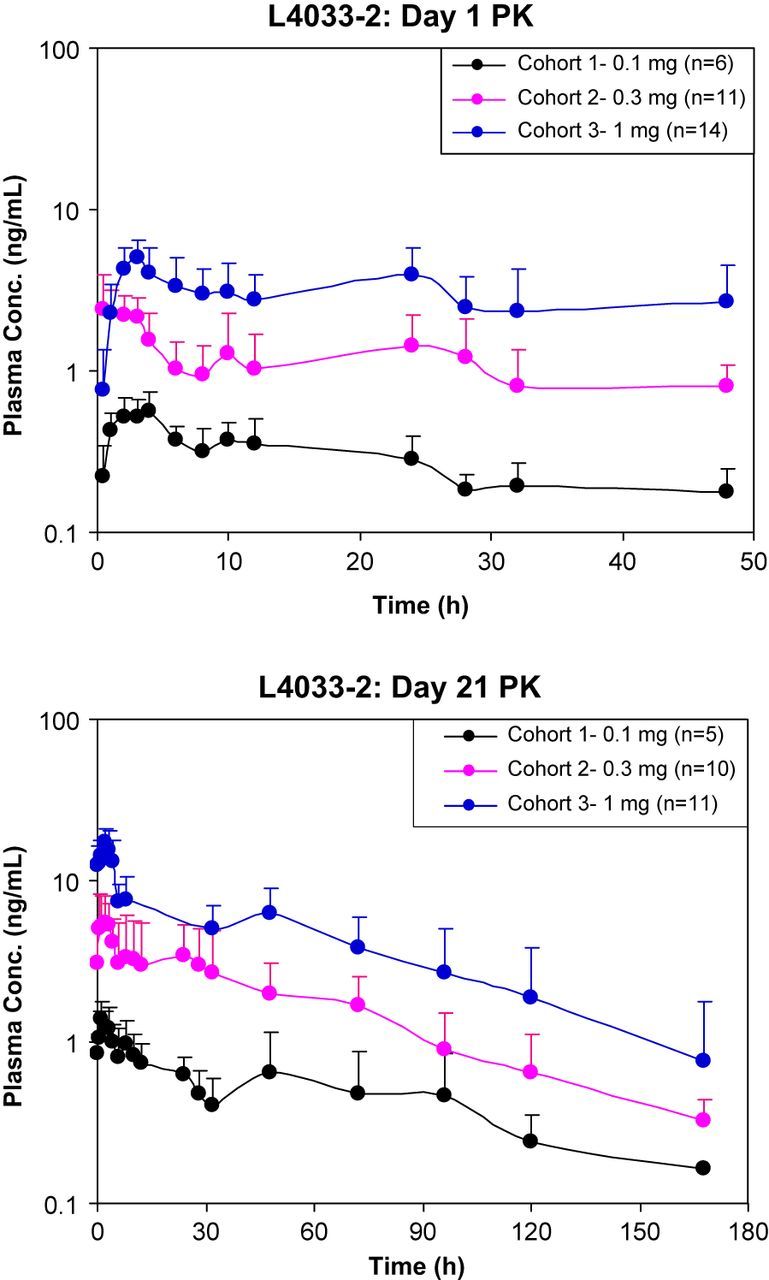
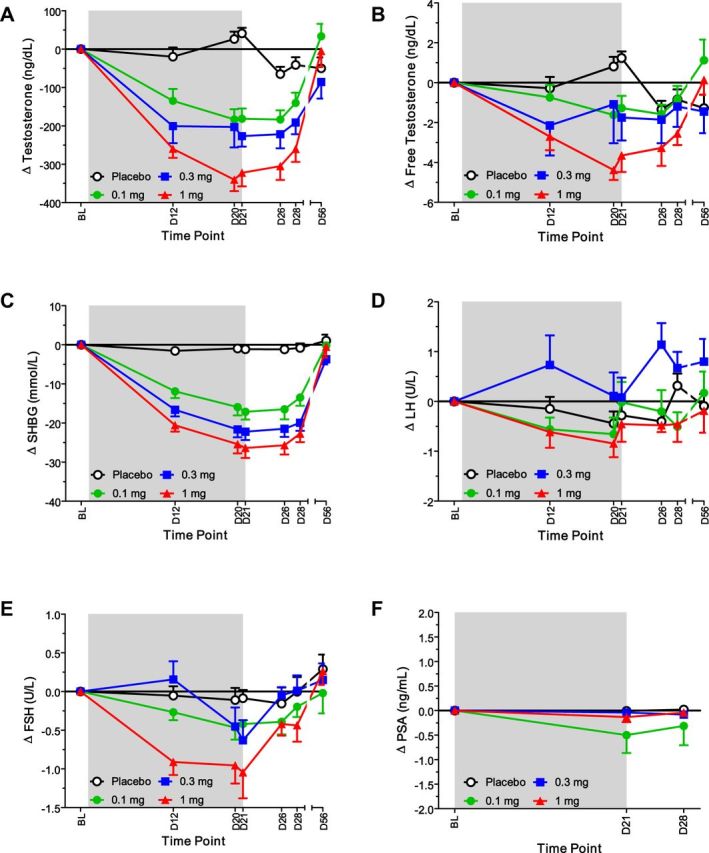
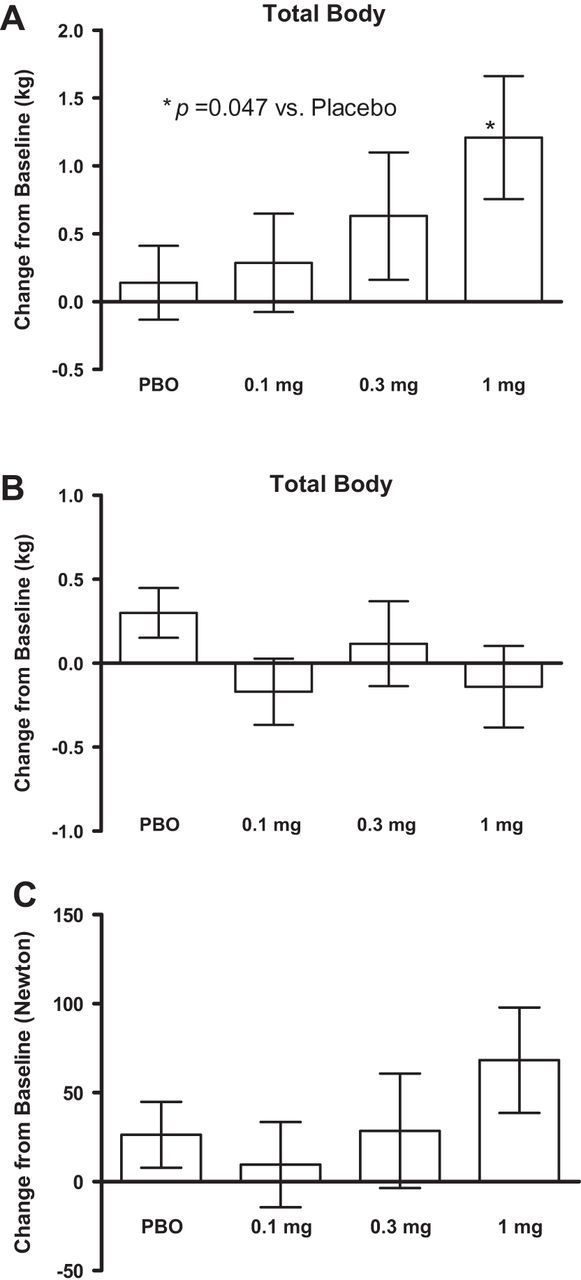
Results: LGD-4033 was well tolerated. There were no drug-related serious adverse events. Frequency of adverse events was similar between active and placebo groups. Hemoglobin, prostate-specific antigen, aspartate aminotransferase, alanine aminotransferase, or QT intervals did not change significantly at any dose. LGD-4033 had a long elimination half-life and dose-proportional accumulation upon multiple dosing. LGD-4033 administration was associated with dose-dependent suppression of total testosterone, sex hormone-binding globulin, high density lipoprotein cholesterol, and triglyceride levels. follicle-stimulating hormone and free testosterone showed significant suppression at 1.0-mg dose only. Lean body mass increased dose dependently, but fat mass did not change significantly. Hormone levels and lipids returned to baseline after treatment discontinuation.

Conclusions: LGD-4033 was safe, had favorable pharmacokinetic profile, and increased lean body mass even during this short period without change in prostate-specific antigen. Longer randomized trials should evaluate its efficacy in improving physical function and health outcomes in select populations.


Figures

Figure 1.
Figure 1.
Pharmacokinetics of LGD-4033 in Healthy Men. Legend.LGD-4033 concentrations were measured in venous blood collected at 0, 0.5, 1, 2, 3, 4, 6, 8, 10, 12, 24, 28, 32, and 48 hours after the first dose (upper panel). Once-daily dosing recommenced on day 3. On day 21, venous blood was collected at 0, 0.5, 1, 2, 3, 4, 6, 8, 10, 12, 24, 28, 32, 48, 72, 96, 120, and 168 hours after day 21 dosing (lower panel).
Figure 2.
Figure 2.
(A) The effects of LGD-4033 selective androgen receptor modulator on serum total testosterone levels. Change from baseline in serum total testosterone levels are shown. The data are mean ± standard error of the mean (SEM), n = 33 in the placebo group, 18 in the 0.1-mg dose, 11 in the 0.3-mg group, and 14 in the 1.0-mg group. BL = baseline. The shaded area highlights the 21-day treatment period. (B) Change in the free testosterone levels from baseline. Change from baseline in serum free testosterone levels is shown. The data are mean ± SEM, n = 33 in the placebo group, 18 in the 0.1-mg dose, 11 in the 0.3-mg group, and 14 in the 1.0-mg group. BL = baseline. The shaded area highlights the 21-day treatment period. (C) Change in sex hormone–binding globulin levels from baseline. Change from baseline in serum sex hormone–binding globulin levels is shown. The data are mean ± SEM, n = 33 in the placebo group, 18 in the 0.1-mg dose, 11 in the 0.3-mg group, and 14 in the 1.0-mg group. BL = baseline. The shaded area highlights the 21-day treatment period. (D) Change in luteinizing hormone (U/L) levels from baseline. Change from baseline in serum luteinizing hormone levels is shown. The data are mean ± SEM, n = 33 in the placebo group, 18 in the 0.1-mg dose, 11 in the 0.3-mg group, and 14 in the 1.0-mg group. BL = baseline. The shaded area highlights the 21-day treatment period. (E) Change in follicle-stimulating hormone (U/L) levels from baseline. Change from baseline in serum follicle-stimulating hormone levels is shown. The data are mean ± SEM, n = 33 in the placebo group, 18 in the 0.1-mg dose, 11 in the 0.3-mg group, and 14 in the 1.0-mg group. BL = baseline. The shaded area highlights the 21-day treatment period. (F) Change in prostate-specific antigen (ng/mL) levels from baseline. Change from baseline in prostate-specific antigen levels is shown. The data are mean ± SEM, n = 33 in the placebo group, 18 in the 0.1-mg dose, 11 in the 0.3-mg group, and 14 in the 1.0-mg group. BL = baseline. The shaded area highlights the 21-day treatment period.
Figure 3.
Figure 3.
(A) Mean (SE) lean mass (kg) change from baseline up to day 28. Change from baseline in lean body mass is shown. The data are mean ± standard error of the mean, n = 30 in the placebo group pooled from the three cohorts, 17 in the 0.1-mg dose, 10 in the 0.3-mg group, and 11 in the 1.0-mg group. BL = baseline. *p < .05 vs placebo. PBO = placebo; p for trend = .04. (B) Mean (SE) fat mass (kg) change from baseline up to day 28. Change from baseline in fat mass is shown. The data are mean ± standard error of the mean, n = 30 in the placebo group pooled from the three cohorts, 17 in the 0.1-mg dose, 10 in the 0.3-mg group, and 11 in the 1.0-mg group. PBO = placebo. p for trend = .261. (C) Change in leg press strength (Newton) from baseline. Change from baseline in fat mass is shown. The data are mean ± standard error of the mean, n = 30 in the placebo group pooled from the three cohorts, 17 in the 0.1-mg dose, 10 in the 0.3-mg group, and 11 in the 1.0-mg group. PBO = placebo; p for trend = .203.

References

    1. Baumgartner RN, Waters DL, Gallagher D, Morley JE, Garry PJ. Predictors of skeletal muscle mass in elderly men and women. Mech Ageing Dev. 1999;107:123–136. - PubMed
    1. Roy TA, Blackman MR, Harman SM, Tobin JD, Schrager M, Metter EJ. Interrelationships of serum testosterone and free testosterone index with FFM and strength in aging men. Am J Physiol Endocrinol Metab. 2002;283:E284–E294. - PubMed
    1. Melton LJ, III, Khosla S, Crowson CS, O’Connor MK, O’Fallon WM, Riggs BL. Epidemiology of sarcopenia. J Am Geriatr Soc. 2000;48:625–630. - PubMed
    1. Bassey EJ, Fiatarone MA, O’Neill EF, Kelly M, Evans WJ, Lipsitz LA. Leg extensor power and functional performance in very old men and women. Clin Sci (Lond) 1992;82:321–327. - PubMed
    1. Lexell J, Downham D, Sjostrom M. Distribution of different fibre types in human skeletal muscles. A statistical and computational study of the fibre type arrangement in m. vastus lateralis of young, healthy males. J Neurol Sci. 1984;65:353–365. - PubMed

Publication types

MeSH terms