

ZntR-mediated transcription of zntA responds to nanomolar intracellular free zinc
- PMID: 22459916
- PMCID: PMC3408962
- DOI: 10.1016/j.jinorgbio.2012.02.008
ZntR-mediated transcription of zntA responds to nanomolar intracellular free zinc
Abstract
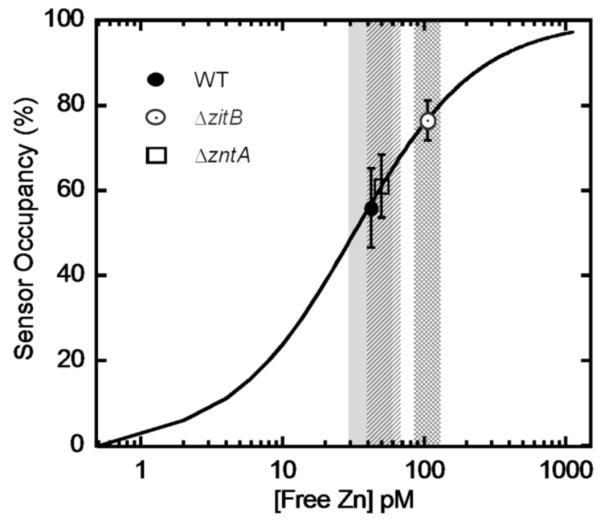
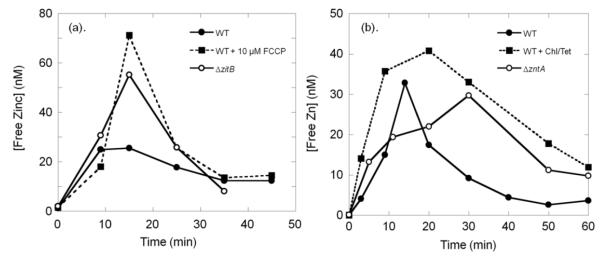
In E. coli, ZitB and ZntA are important metal exporters that enhance cell viability under high environmental zinc. To understand their functions in maintaining zinc homeostasis, we applied a novel genetically-encoded fluorescent zinc sensor to monitor the intracellular free zinc changes in wild type, ∆zitB and ∆zntA E. coli cells upon sudden exposure to toxic levels of zinc ("zinc shock"). The intracellular readily exchangeable zinc concentration (or "free" zinc) increases transiently from picomolar to nanomolar levels, accelerating zinc-activated gene transcription. After zinc shock, the zitB mRNA level is constant while the zntA mRNA increases substantially in a zinc-dependent manner. In the ∆zitB E. coli strain the free zinc concentration rises more rapidly after zinc shock compared to wild type cells while a prolonged accumulation of free zinc is observed in the ∆zntA strain. Based on these results, we propose that ZitB functions as a constitutive, first-line defense against toxic zinc influx, while ZntA is up-regulated to efficiently lower the free zinc concentration. Furthermore, the ZntR-mediated transcription of zntA exhibits an apparent K(1/2) for zinc activation in the nanomolar range in vivo, significantly higher than the femtomolar affinity for zinc binding and transcription activation previously measured in vitro. A kinetically-controlled transcription model is sufficient to explain the observed regulation of intracellular free zinc concentration by ZntR and ZntA after zinc shock.
Copyright © 2012 Elsevier Inc. All rights reserved.
Figures


Similar articles
-
Ligand-controlled proteolysis of the Escherichia coli transcriptional regulator ZntR.J Bacteriol. 2007 Apr;189(8):3017-25. doi: 10.1128/JB.01531-06. Epub 2007 Jan 12. J Bacteriol. 2007. PMID: 17220226 Free PMC article.
-
Roles of Agrobacterium tumefaciens C58 ZntA and ZntB and the transcriptional regulator ZntR in controlling Cd2+/Zn2+/Co2+ resistance and the peroxide stress response.Microbiology (Reading). 2015 Sep;161(9):1730-1740. doi: 10.1099/mic.0.000135. Epub 2015 Jul 17. Microbiology (Reading). 2015. PMID: 26296876
-
Cd(II), Pb(II) and Zn(II) ions regulate expression of the metal-transporting P-type ATPase ZntA in Escherichia coli.FEBS Lett. 2000 May 4;473(1):67-70. doi: 10.1016/s0014-5793(00)01509-x. FEBS Lett. 2000. PMID: 10802061
-
ZntR is an autoregulatory protein and negatively regulates the chromosomal zinc resistance operon znt of Staphylococcus aureus.Mol Microbiol. 1999 Jul;33(1):200-7. doi: 10.1046/j.1365-2958.1999.01466.x. Mol Microbiol. 1999. PMID: 10411736
-
Modulating the Properties of Metal-Sensing Whole-Cell Bioreporters by Interfering with Escherichia coli Metal Homeostasis.J Microbiol Biotechnol. 2018 Feb 28;28(2):323-329. doi: 10.4014/jmb.1710.10012. J Microbiol Biotechnol. 2018. PMID: 29212299
Cited by
-
The Escherichia coli small protein MntS and exporter MntP optimize the intracellular concentration of manganese.PLoS Genet. 2015 Mar 16;11(3):e1004977. doi: 10.1371/journal.pgen.1004977. eCollection 2015 Mar. PLoS Genet. 2015. PMID: 25774656 Free PMC article.
-
Transcriptome Response to Heavy Metals in Sinorhizobium meliloti CCNWSX0020 Reveals New Metal Resistance Determinants That Also Promote Bioremediation by Medicago lupulina in Metal-Contaminated Soil.Appl Environ Microbiol. 2017 Sep 29;83(20):e01244-17. doi: 10.1128/AEM.01244-17. Print 2017 Oct 15. Appl Environ Microbiol. 2017. PMID: 28778889 Free PMC article.
-
Effects of leachate from crumb rubber and zinc in green roofs on the survival, growth, and resistance characteristics of Salmonella enterica subsp. enterica serovar Typhimurium.Appl Environ Microbiol. 2014 May;80(9):2804-10. doi: 10.1128/AEM.03565-13. Epub 2014 Feb 28. Appl Environ Microbiol. 2014. PMID: 24584242 Free PMC article.
-
Zinc-dependent regulation of zinc import and export genes by Zur.Nat Commun. 2017 Jun 9;8:15812. doi: 10.1038/ncomms15812. Nat Commun. 2017. PMID: 28598435 Free PMC article.
-
Fluorescent sensors for measuring metal ions in living systems.Chem Rev. 2014 Apr 23;114(8):4564-601. doi: 10.1021/cr400546e. Epub 2014 Mar 3. Chem Rev. 2014. PMID: 24588137 Free PMC article. Review. No abstract available.
References
Publication types
MeSH terms
Substances
Grants and funding
LinkOut - more resources
Full Text Sources
Molecular Biology Databases
