. 2012 Sep;19(9):1561-70.
doi: 10.1038/cdd.2012.34. Epub 2012 Mar 30.

Apoptosis-induced mitochondrial dysfunction causes cytoplasmic lipid droplet formation

Affiliations

Apoptosis-induced mitochondrial dysfunction causes cytoplasmic lipid droplet formation

J Boren et al. Cell Death Differ. 2012 Sep.

Abstract

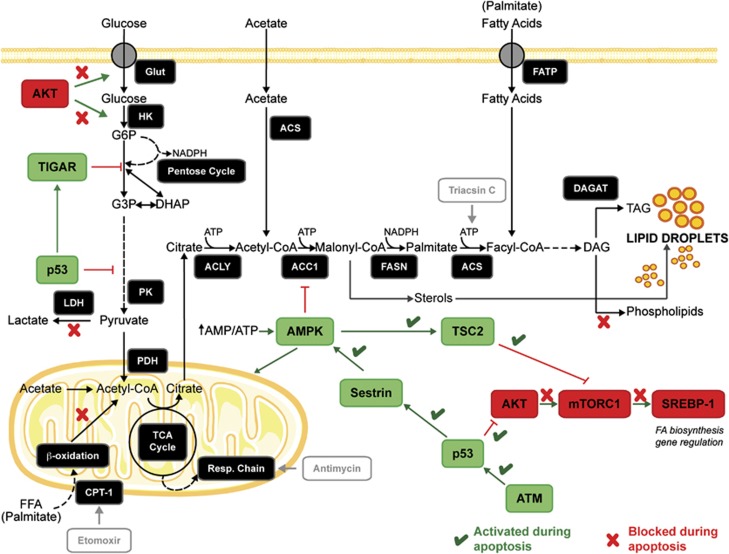
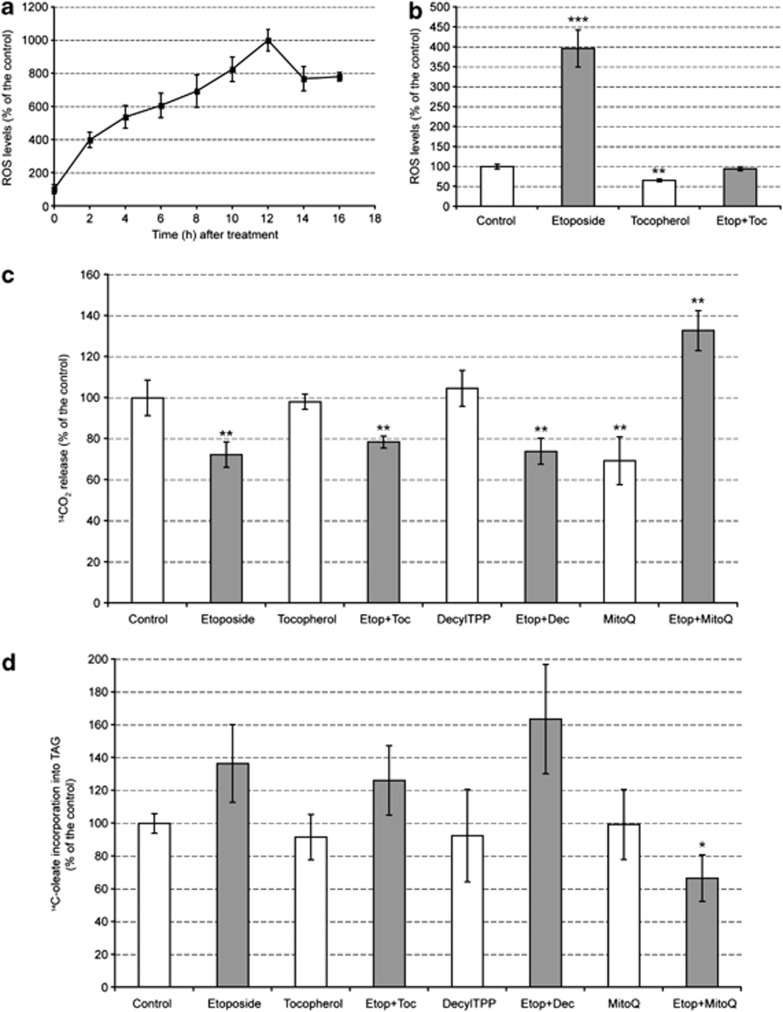
A characteristic of apoptosis is the rapid accumulation of cytoplasmic lipid droplets, which are composed largely of neutral lipids. The proton signals from these lipids have been used for the non-invasive detection of cell death using magnetic resonance spectroscopy. We show here that despite an apoptosis-induced decrease in the levels and activities of enzymes involved in lipogenesis, which occurs downstream of p53 activation and inhibition of the mTOR signaling pathway, the increase in lipid accumulation is due to increased de novo lipid synthesis. This results from inhibition of mitochondrial fatty acid β-oxidation, which coupled with an increase in acyl-CoA synthetase activity, diverts fatty acids away from oxidation and into lipid synthesis. The inhibition of fatty acid oxidation can be explained by a rapid rise in mitochondrial membrane potential and an attendant increase in the levels of reactive oxygen species.


Figures

Figure 1
Figure 1
Apoptosis affects cell signaling pathways that control lipid synthesis and energy metabolism. The enzymes involved in de novo lipid synthesis are depicted as well as the signaling pathways that regulate them. Lipids are synthesized from citrate, which is transported into the cytosol following synthesis in the mitochondria by condensation of acetyl-CoA with oxaloacetate. Glucose is the principal origin of citrate carbon, although other metabolites can also be used as carbon donors. Lipid synthesis also requires NADPH, which originates from the pentose phosphate pathway and from the reaction catalyzed by malic enzyme. Pictures of the mitochondrion and cell membrane were obtained from Servier Medical Art (www.servier.com). ACC1, acetyl-CoA carboxylase; ACLY, ATP-citrate lyase; ACS, acyl-CoA synthetase; AMPK, AMP-activated kinase; ATM, ataxia-telangiectasia mutated; CPT-1, carnitine palmitoyltransferase 1; DAG, diacylglycerides; DAGAT, diacylglycerol acyltransferase; DHAP, dihydroxyacetone phosphate; FASN, fatty acid synthase; FATP, fatty acid transport protein; FFA, free fatty acids; G3P, glyceraldehyde 3-phosphate; G6P, glucose 6-phosphate; Glut, glucose transporter; HK, hexokinase; LDH, lactate dehydrogenase; PDH, pyruvate dehydrogenase; PK, pyruvate kinase; SREBP-1, sterol-receptor element binding protein; TAG, triacylglycerides; TIGAR, Tp53-induced glycolysis and apoptosis regulator; TSC2, tuberous sclerosis complex 2
Figure 2
Figure 2
Apoptosis induction increases lipid droplet content and mitochondrial membrane potential in EL4 cells. (a) Representative images obtained with an ImageStream imaging flow cytometer. Cells were treated with 15 μM etoposide for 2, 8 or 16 h, after which they were stained with Bodipy 496/503 (stains neutral lipids), MTO (stains mitochondria in a membrane potential-dependent manner), 7AAD (a DNA stain indicating late apoptosis or necrosis) and AV-AF647 (an indicator of early apoptosis). (b) Fraction of viable, early apoptotic and late apoptotic/necrotic cells. Cell populations were gated according to their AV/7AAD staining. Results are expressed as mean±S.E.M. and indicate the average values of at least four different experiments with 10 000 cells analyzed per sample. (c) Quantification of lipid droplet number, which was assessed as described in Materials and Methods, and MTO intensity as a measure of mitochondrial membrane potential (expressed in arbitrary units), after induction of cell death. Results are expressed as mean±S.E.M., n=4. *P<0.05, **P<0.01, ***P<0.001
Figure 3
Figure 3
Etoposide-induced apoptosis enhances lipogenesis. (a) Cells were incubated with 14C-acetate for 1 h before harvesting at the indicated times after etoposide treatment. Lipids were extracted and the extract volume normalized for cell number before the lipids were separated on a thin layer chromatography (TLC) plate. A representative autoradiograph indicating 14C-acetate incorporation into the different neutral lipid species is shown. (b) Representative autoradiograph of the polar lipid fraction on TLC plates showing 14C-acetate incorporation. (c) 14C-acetate incorporation into TAG determined by densitometric analysis of the autoradiographs. The values represent the percentage incorporation relative to control (mean±S.D., n=9). (d) Representative autoradiograph of 14C-palmitate incorporation into the neutral lipid fraction on TLC plates. The cells were incubated with 14C-palmitate for 1 h before harvesting at the indicated times after etoposide treatment. The volume of the lipid extraction buffer was normalized to cell number. (e) Representative autoradiograph of the polar lipid fraction on TLC plates from cells incubated with 14C-palmitate. (f) 14C-palmitate incorporation into TAG determined by densitometry. The values represent the percentage incorporation relative to control (mean±S.D., n=9). (g) Cell viability after etoposide treatment measured by Trypan blue dye exclusion assay. Results are expressed as mean±S.D. (n=9). (h) Representative western blot showing the effect of etoposide treatment on caspase 3 cleavage (n=3). *P<0.05, **P<0.01, ***P<0.001. CE, cholesterol esters; Chol, cholesterol; DAG, diacylglycerides; Etop, etoposide; FFA, free fatty acids; N, neutral lipids; P, polar lipids; PC, phosphatidylcholine; PE, phosphatidylethanolamine; PS, phosphatidylserine; TAG, triacylglycerides
Figure 4
Figure 4
Apoptosis modulates signaling pathways that alter gene expression, protein levels and phosphorylation status of lipogenic enzymes. EL4 cells were treated with 15 μM etoposide for up to 16 h and protein samples were obtained every 2 h. (a) Representative western blots showing of the effect of apoptosis induction on the levels of p53, Akt, p-Akt (Ser473), pS6K (Ser371), pS6K (Thr389), AMPK and p-AMPK (Thr172). Actin was used as an internal control for protein loading. (b) Expression levels of Sestrin 2 (formula image) and p21 (formula image
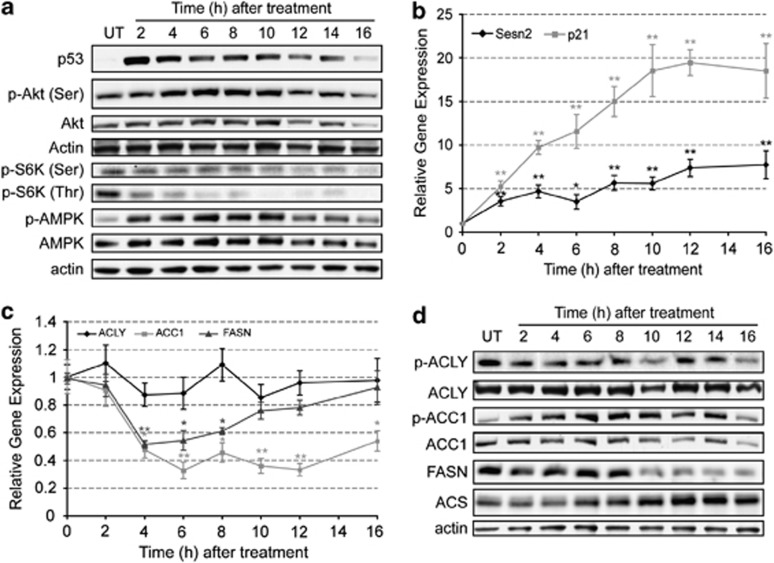
) obtained by quantitative polymerase chain reaction (PCR). Results are expressed in relation to their initial levels (untreated controls). Actin expression levels were used to normalize the results (mean±S.E.M.; *P<0.01, **P<0.001, n=3). (c) Expression levels of ACLY (formula image), ACC1 (formula image) and FASN (formula image) obtained by quantitative PCR. Results were normalized to the actin levels in each sample and expressed relative to the untreated control (mean±S.E.M.; *P<0.01, **P<0.001, n=3). (d) Western blot analysis of the levels of ACLY, p-ACLY (Ser454), ACC1, p-ACC1 (Ser79), FASN and ACS. Actin was used as an internal protein loading control. A representative sample is shown for each protein
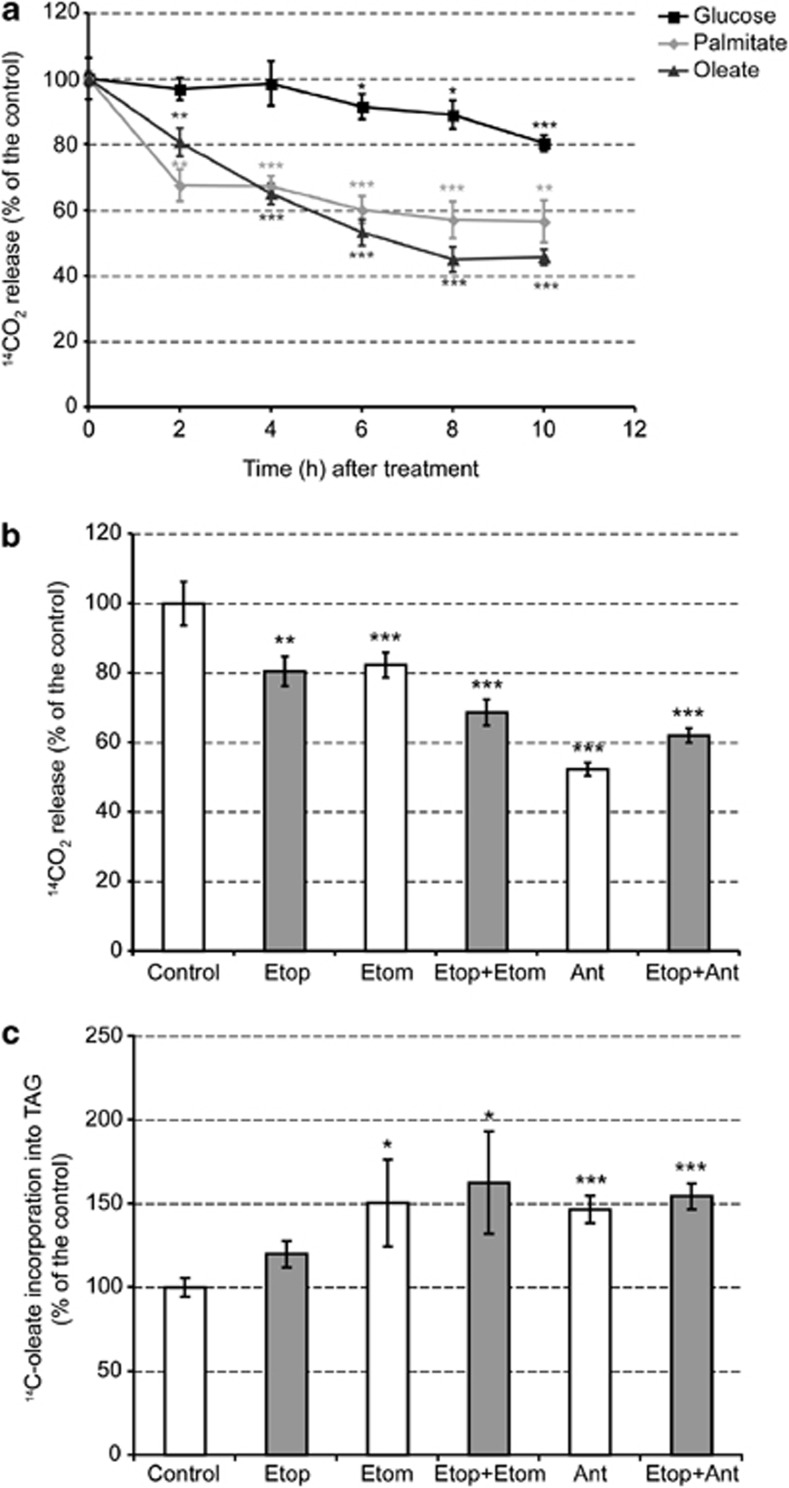
Figure 5
Figure 5
Apoptosis decreases mitochondrial fatty acid β-oxidation. (a) EL4 cells were treated with 15 μM etoposide for the indicated times and 1 h before harvesting, 1 μCi/ml [1-14C]palmitate, 0.5 μCi/ml [1-14C]oleate or 2 μCi/ml D-[U-14C]glucose were added to the culture medium. Counts in trapped 14CO2 were normalized to the total cell number and expressed as a percentage of the untreated control cells (mean±S.E.M., n=9). (b) Oleate oxidation was measured in cells treated for 2 h with different combinations of 15 μM etoposide (Etop), 100 μM etomoxir (Etom) and/or 10 μM antimycin (Ant). Neither etomoxir nor antimycin treatment affected cell viability (mean±S.E.M., n=6). (c) Oleate incorporation into TAG after treatment as in (b), assessed by densitometric analysis of autoradiographs of thin layer chromatography (TLC) plates (mean±S.E.M., n=6). *P<0.05, **P<0.01, ***P<0.001
Figure 6
Figure 6
Apoptosis induction increases the levels of ROS in the cell. (a) ROS levels were measured by flow cytometry after staining the cells with carboxy-H2DCFDA and are expressed as the percentage increase in median fluorescence compared to untreated controls (mean±S.E.M.; P<0.005 in all points, n=6). (b) Cells were pretreated for 1 h with 9.5 μg/ml tocopherol (Toc), after which etoposide (Etop) was added into the cell medium for a further 2 h and then the cells were harvested. Results were expressed as the percentage of the values in control cells (mean±S.E.M., n=3). (c) 14C-oleate was added to cells 1 h before harvest to assess β-oxidation. Results are expressed relative to the level of oxidation in control cells as the mean±S.E.M., n=6. (d) The lipid fraction was obtained from cells treated as in (c) and densitometric analysis of autoradiographs of thin layer chromatography (TLC) plates was used to assess oleate incorporation into TAG, as described in Materials and methods. In (c) and (d), 1 μM MitoQ, 1 μM DecylTPP (Dec) or 9.5 μg/ml tocopherol were added to the cells 1 h before adding 15 μM etoposide and the cells were then incubated for a further 2 h. Dec was used to control for the effect of the triphenylphosphonium ion on mitochondrial function. Results are expressed as percentage of incorporation relative to untreated controls (mean±S.E.M., n=6). Significantly different from control at: *P<0.05, **P<0.01, ***P<0.001

References

    1. Buchakjian MR, Kornbluth S. The engine driving the ship: metabolic steering of cell proliferation and death. Nat Rev Mol Cell Biol. 2010;11:715–727. - PubMed
    1. Engelman JA, Luo J, Cantley LC. The evolution of phosphatidylinositol 3-kinases as regulators of growth and metabolism. Nat Rev Genet. 2006;7:606–619. - PubMed
    1. Bensaad K, Tsuruta A, Selak MA, Vidal MNC, Nakano K, Bartrons R, et al. TIGAR, a p53-inducible regulator of glycolysis and apoptosis. Cell. 2006;126:107–120. - PubMed
    1. Hu W, Zhang C, Wu R, Sun Y, Levine A, Feng Z. Glutaminase 2, a novel p53 target gene regulating energy metabolism and antioxidant function. Proc Natl Acad Sci. 2010;107:7455–7460. - PMC - PubMed
    1. Vousden KH, Prives C. Blinded by the light: the growing complexity of p53. Cell. 2009;137:413–431. - PubMed

Publication types

MeSH terms