. 2012 Jun 1;302(11):G1322-35.
doi: 10.1152/ajpgi.00018.2012. Epub 2012 Mar 29.

Knockout of Mkp-1 exacerbates colitis in Il-10-deficient mice

Affiliations

Knockout of Mkp-1 exacerbates colitis in Il-10-deficient mice

Ranyia Matta et al. Am J Physiol Gastrointest Liver Physiol. .

Abstract

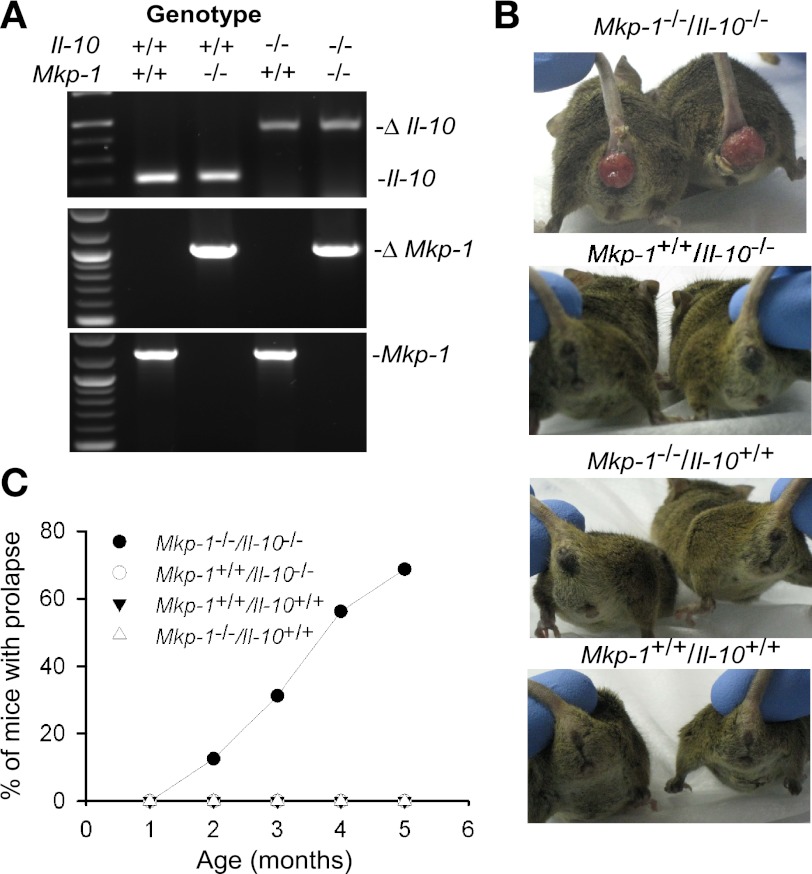
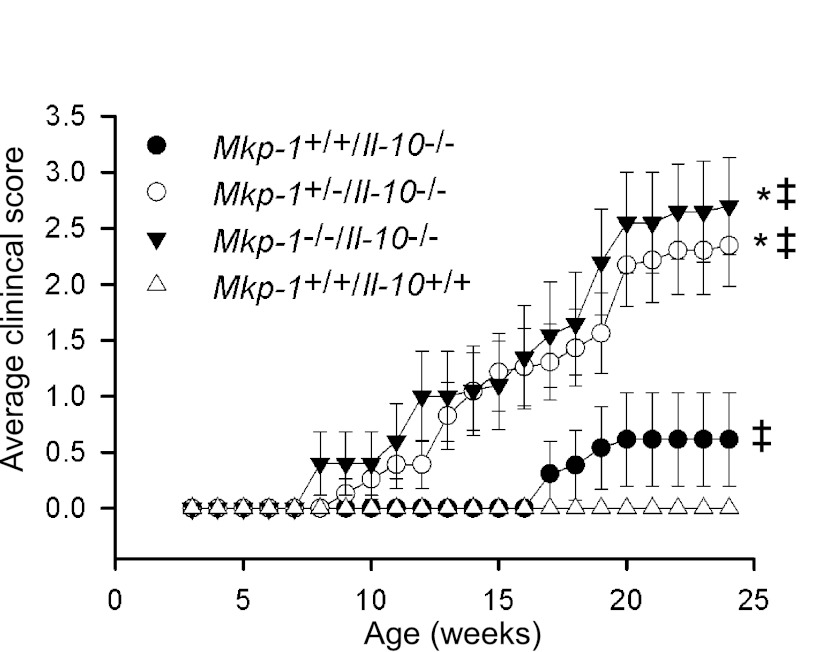
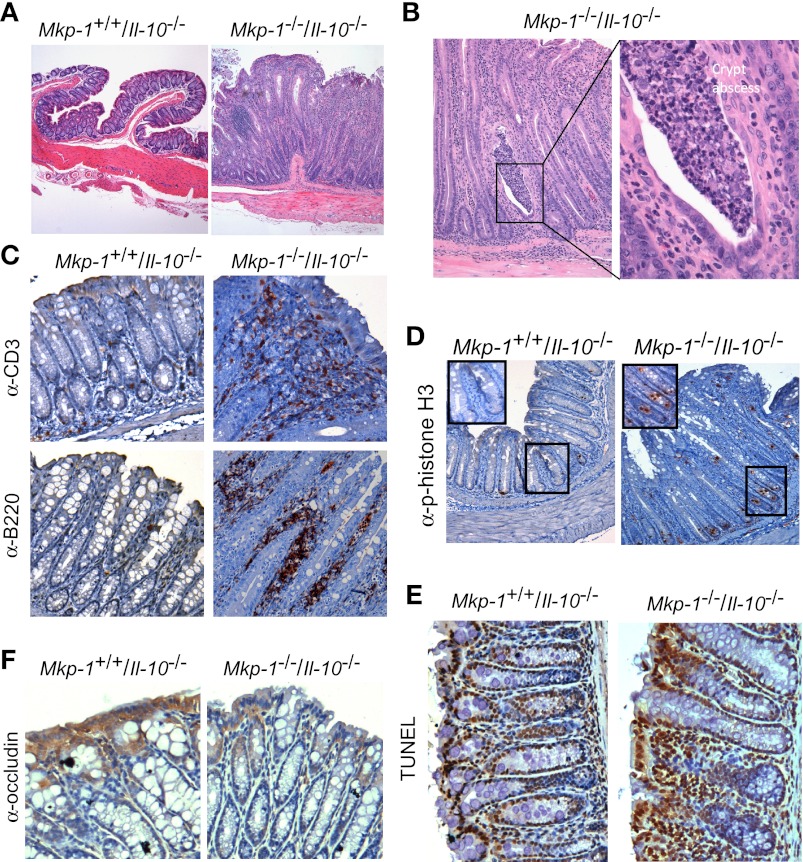
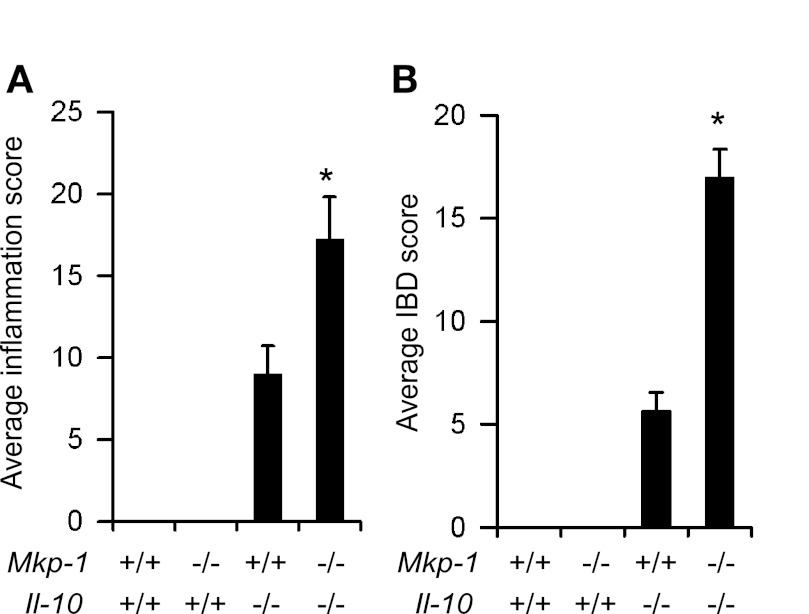
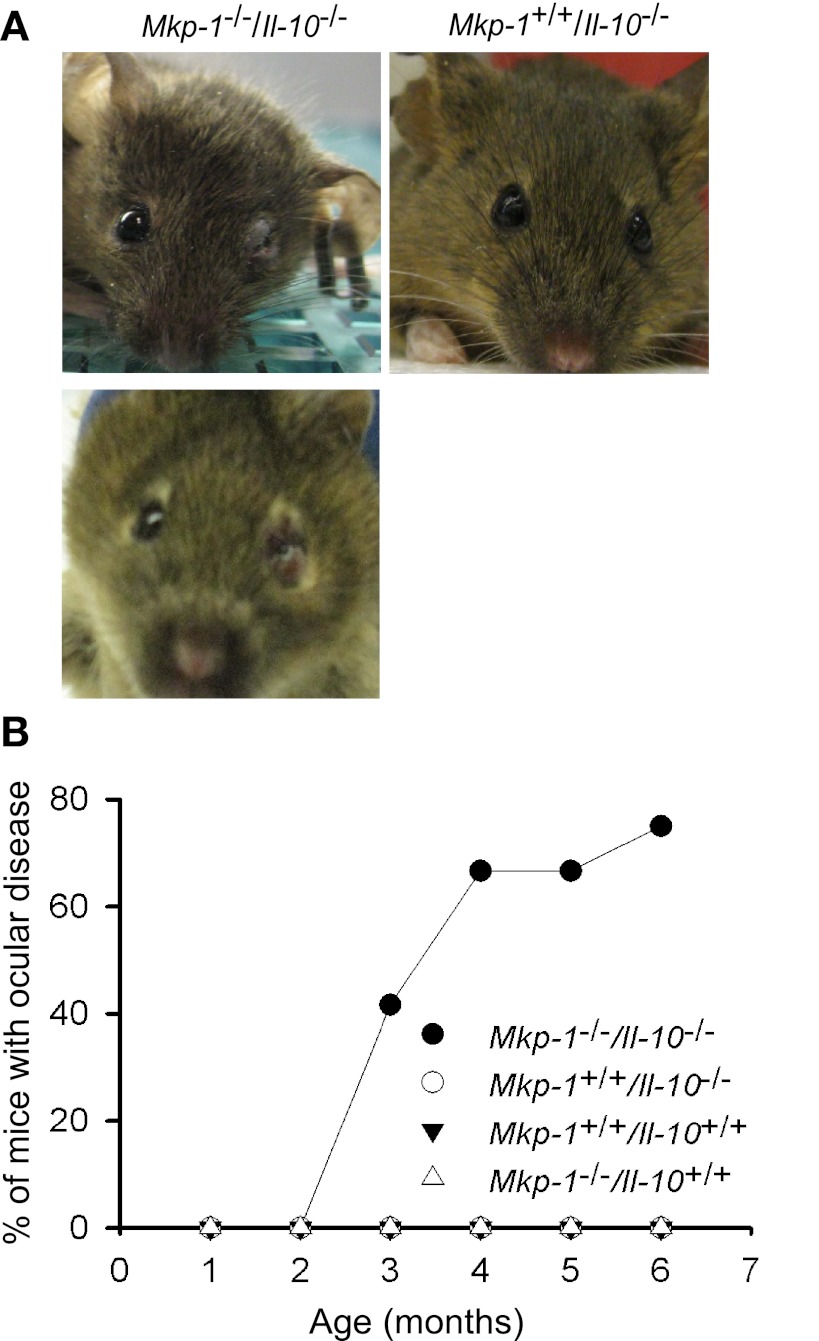
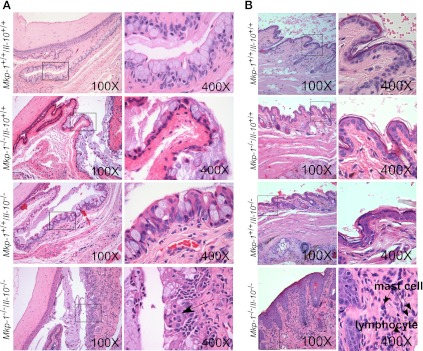
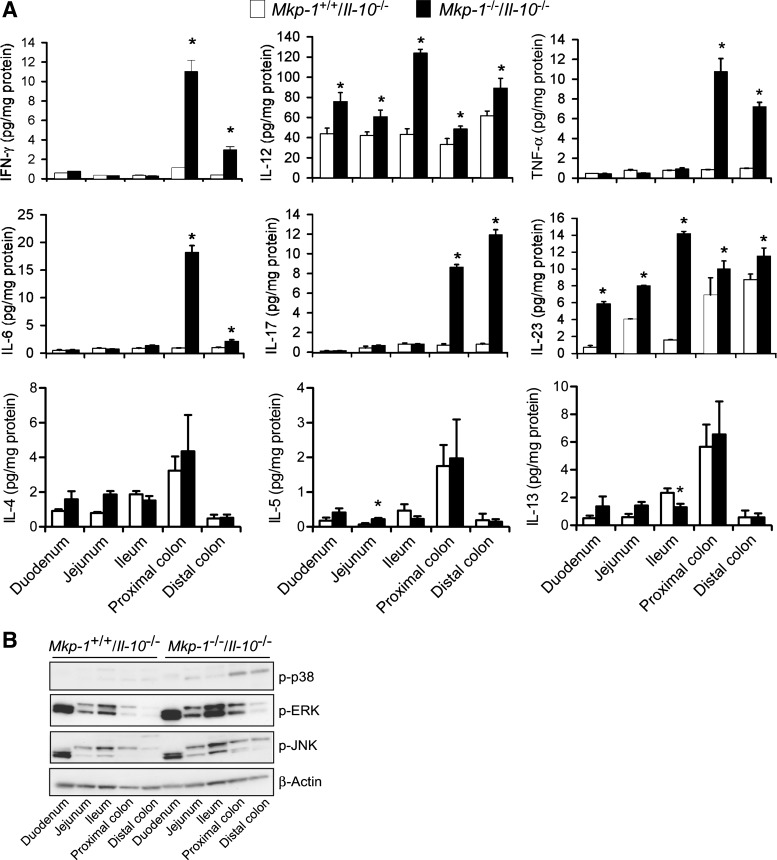
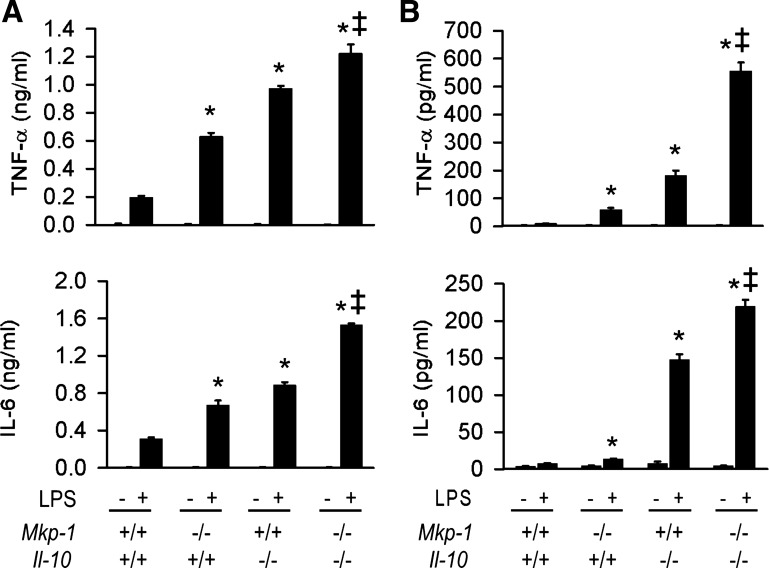
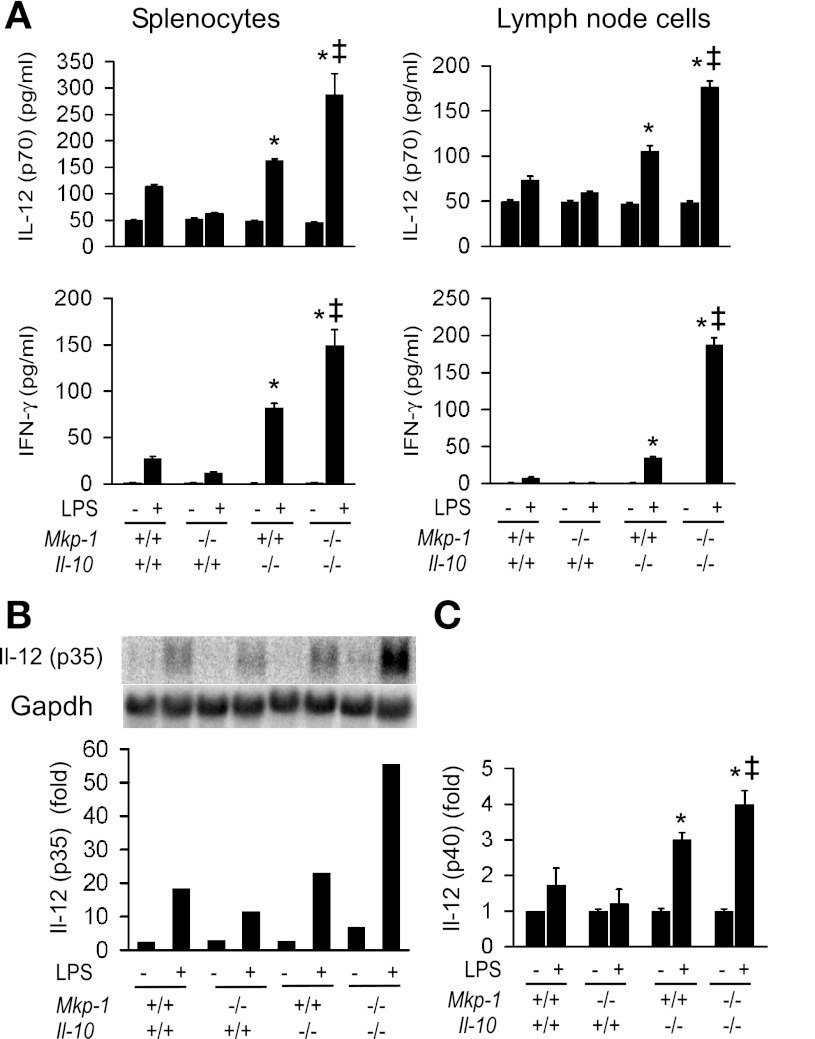
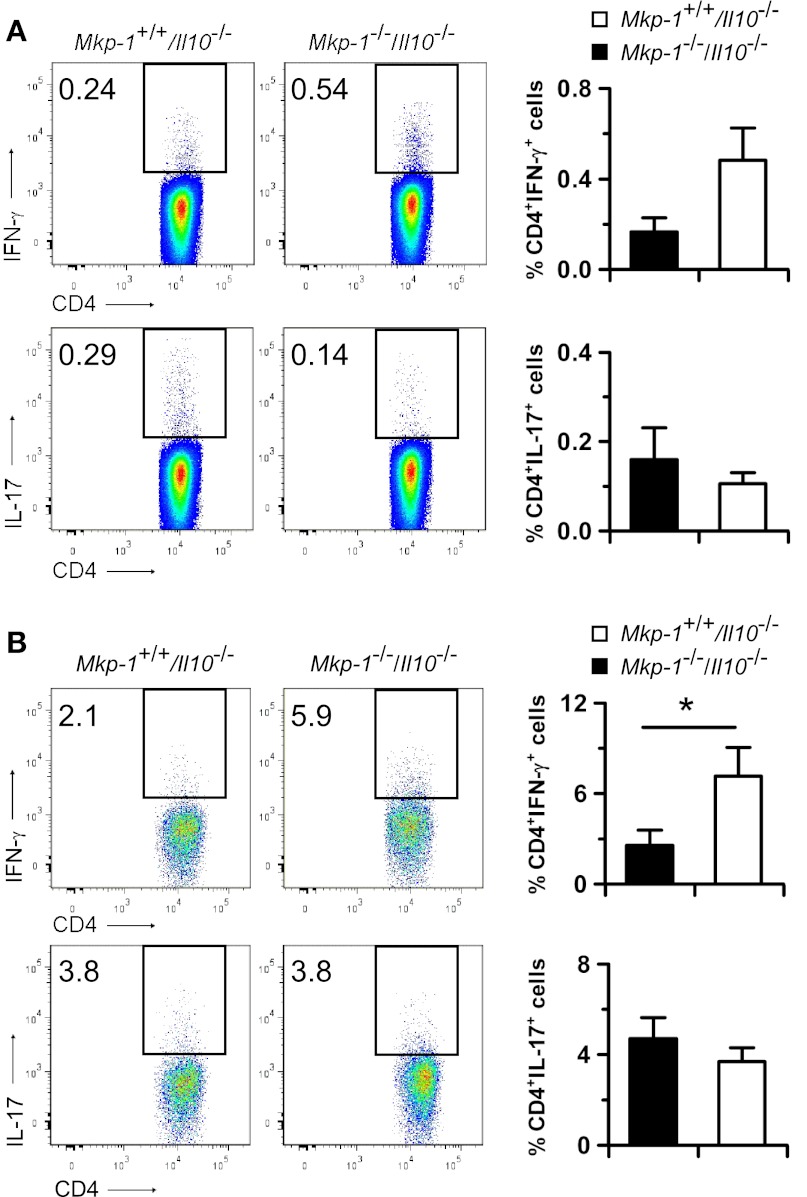
Il-10-deficient mice develop colitis associated with exaggerated Th1/Th17 responses and are a valuable model of inflammatory bowel disease. Mkp-1 is a major negative regulator of MAPKs, and its expression is enhanced by IL-10. To understand the role of Mkp-1 in the regulation of intestinal mucosal immune responses, we studied the effect of Mkp-1 deletion on the pathogenesis of colitis in Il-10(-/-) mice. We found that knockout of Mkp-1 on an Il-10(-/-) background accelerated the development of colitis. Compared with Il-10(-/-) mice, colitis not only appeared earlier but also was more severe in Il-10(-/-)/Mkp-1(-/-) mice. Il-10(-/-) mice exhibited a mild intestinal inflammation in the specific pathogen-free environment, and rectal prolapse rarely appeared before 6 mo of age. In contrast, the majority of Il-10(-/-)/Mkp-1(-/-) mice developed severe colitis rapidly and presented with rectal prolapse after only 2-3 mo. The colon of Il-10(-/-)/Mkp-1(-/-) mice showed diffuse transmural chronic inflammation and mucosal hyperplasia, with significantly more proliferating crypt epithelial cells than those of Il-10(-/-) mice. In addition to the severe colitis, Il-10(-/-)/Mkp-1(-/-) mice also developed conjunctivitis and blepharitis. The colon of Il-10(-/-)/Mkp-1(-/-) mice contained significantly higher levels of proinflammatory cytokines and exhibited greater MAPK activities than did the colon of Il-10(-/-) mice. Splenocytes and lymphocytes from Il-10(-/-)/Mkp-1(-/-) mice produced higher levels of Th1 cytokines ex vivo upon activation than did cells from Il-10(-/-) mice. Our studies support a pivotal role of Mkp-1 as a negative regulator of mucosal immune responses and highlight its protective function against inflammatory bowel disease.


Figures

Fig. 1.
Fig. 1.
Mice deficient in both Mkp-1 and Il-10 develop a high incidence of rectal prolapse. Mice were housed in a specific pathogen-free (SPF) environment and scored for the development of rectal prolapse over 5 mo. A: genotyping of Mkp-1+/+/Il-10+/+, Mkp-1−/−/Il-10+/+, Mkp-1+/+/Il-10−/−, and Mkp-1−/−/Il-10−/− mice by PCR. B: representative images of rectal prolapse of Mkp-1−/−/Il-10−/− mice. C: time course of rectal prolapse in various genotype groups (n = 16 for each genotype).
Fig. 2.
Fig. 2.
Knockout of Mkp-1 not only accelerates the induction of colitis but also exacerbates the severity of colitis in Il-10 knockout mice. Mkp-1+/+/Il-10+/+, Mkp-1+/+/Il-10−/−, Mkp-1+/−/Il-10−/−, and Mkp-1−/−/Il-10−/− mice housed in a SPF environment were monitored weekly to score the severity of their colitis. The clinical scoring criteria included 6 parameters: loss of more than 5% of body weight, rectal prolapse, perianal mucus, rectal bleeding, wet stool consistency, and death. Mice were given a score of either 0 (parameter absent) or 1 (parameter present) for each parameter (maximum possible score per mouse = 6). Scores in the graph were averaged from individual animals in each group (n = 20–24 per group) and presented as means ± SE. *P < 0.05, compared with Mkp-1+/+/Il-10−/− mice; ‡P < 0.05, compared with Mkp-1+/+/Il-10+/+ mice (Student's t-test). Note the more severe disease in Mkp-1+/−/Il-10−/− mice relative to Mkp-1+/+/Il-10−/− mice.
Fig. 3.
Fig. 3.
Mkp-1 deficiency exacerbates the epithelial proliferation and inflammation of the large intestine of Il-10 knockout mice. Mice were housed in a SPF environment and euthanized at 8 wk of age. The colon was excised and fixed for histology and immunohistochemistry analyses. The colon of wild-type (Mkp-1+/+/Il-10+/+) and Mkp-1 knockout (Mkp-1−/−/Il-10+/+) mice appeared normal (data not shown). A: histology of hematoxylin and eosin (H&E)-stained colon sections. Note the marked mucosal epithelial hyperplasia in the double knockout (Mkp-1−/−/Il-10−/−) section, but not in the Mkp-1+/+/Il-10−/− section. B: mucosal leukocytes infiltration with crypt abscess in the Mkp-1+/+/Il-10−/− section. Image on the right is a high-magnification image of the crypt abscess. C: immunohistochemical detection of T lymphocytes (anti-CD3, top) and B lymphocytes (anti-B220, bottom) in the colon section of the Mkp-1+/+/Il-10−/− and Mkp-1−/−/Il-10−/− mice. D: immunohistochemical detection of the mitotic marker phospho-histone H3 in the rectal mucosa of Mkp-1+/+/Il-10−/− and Mkp-1−/−/Il-10−/− mice. E: detection of apoptosis in the colon section of the Mkp-1+/+/Il-10−/− and Mkp-1−/−/Il-10−/− mice by TUNEL assay. F: immunohistochemical detection of α-occludin in colon, with enhanced positive (brown) signal in the Mkp-1+/+/Il-10−/− section than in the Mkp-1−/−/Il-10−/− section. After immunohistochemical staining the sections were counterstained with hematoxylin. Images shown are representative of at least 3 different sections.
Fig. 4.
Fig. 4.
Double knockout mice exhibit higher histological inflammation and inflammatory bowel disease (IBD) scores than Il-10 knockout mice. The colon was removed at necropsy from 8-wk-old Mkp-1+/+/Il-10+/+, Mkp-1−/−/Il-10+/+, Mkp-1+/+/Il-10−/−, and Mkp-1−/−/Il-10−/− mice. The tissue was flushed with cold PBS and dissected into ascending colon, transverse colon, descending colon, and rectum. The colon of Mkp-1+/+/Il-10+/+, Mkp-1−/−/Il-10+/+ mice were normal. A: inflammation scores of the colon of Mkp-1+/+/Il-10+/+, Mkp-1−/−/Il-10+/+, Mkp-1+/+/Il-10−/−, and Mkp-1−/−/Il-10−/− mice. To calculate the inflammation score, H&E-stained sections were blindly scored based on the criteria listed in Table 1. The total inflammation score was calculated by adding the inflammation scores from the ascending, transverse, and descending colons and rectum (maximum possible inflammation score per animal is 56). B: IBD scores of the colon of Mkp-1+/+/Il-10+/+, Mkp-1−/−/Il-10+/+, Mkp-1+/+/Il-10−/−, and Mkp-1−/−/Il-10−/− mice. The IBD scoring system was based on the parameters outlined in Table 2. Similarly, the scores of all 4 segments were added together to calculate the total IBD score (maximum IBD score per animal is 36). Values shown are means ± SE of at least 3 animals. *P < 0.05, compared with Mkp-1+/+/Il-10−/− mice (Student's t-test).
Fig. 5.
Fig. 5.
Mkp-1/Il-10 double knockout mice develop periocular lesions. Mkp-1+/+/Il-10+/+, Mkp-1−/−/Il-10+/+, Mkp-1+/+/Il-10−/−, and Mkp-1−/−/Il-10−/− mice were housed in a SPF environment and scored for grossly visible eye abnormality over 6 mo. A: representative images of periocular swelling in Mkp-1/Il-10 double knockout mice. B: time course of the development of periocular lesions. Graphical representation showing the percentage of mice that develop ocular disease (n = 12 for each genotype).
Fig. 6.
Fig. 6.
Double knockout mice exhibit conjunctival and eyelid lesions. Mkp-1+/+/Il-10+/+, Mkp-1−/−/Il-10+/+, Mkp-1+/+/Il-10−/−, and Mkp-1−/−/Il-10−/− mice were housed in a SPF environment and were euthanized at 3 mo of age. Eyes and periocular tissues were excised, routinely fixed, and embedded, and sections were stained with H&E. A: conjunctival lesions in double knockout mice. Mkp-1+/+/Il-10+/+ mice lacked conjunctival lesions (top row). Mkp-1−/−/Il-10+/+ and Mkp-1+/+/Il-10−/− mice showed moderately increased goblet cell numbers and mild increased mucus accumulation in the conjunctival space (2nd and 3rd rows). The conjunctival mucosa of Mkp-1−/−/Il-10−/− mice was markedly thickened with moderate goblet cell hyperplasia and moderate to marked mucus accumulation in the conjunctival space (bottom row). Additionally, the conjunctival stroma was expanded by mild edema and infiltrated by neutrophils, with fewer lymphocytes and plasma cells. B: eyelid lesions in Mkp-1/Il-10 double knockout mice. The haired skin of double knockout mouse eyelids mice was markedly thickened and infiltrated by lymphocytes and plasma cells, with scattered clusters of mast cells. Wild-type, Mkp-1−/−/Il-10+/+, or Mkp-1+/+/Il-10−/− mouse eyelids lacked lesions. Column on the right contains high-resolution images of the boxed areas in left column.
Fig. 7.
Fig. 7.
Colons from Mkp-1/Il-10 double knockout mice contain higher levels of proinflammatory cytokines. The intestine of both double knockout and Il-10 knockout mice were divided into duodenum, jejunum, and ileum, as well as proximal and distal colons. Tissues were homogenized to extract soluble proteins. A: levels of cytokines in distinct intestinal regions. IFN-γ, IL-4, IL-5, IL-6, IL-12 (p70), IL-13, IL-17, IL-23 (p19/p40), and TNF-α in the tissue extracts were assessed by ELISA. Values were normalized to total protein content in the tissue homogenates and presented as means ± SE from at least 3 different animals. *P < 0.05, compared with level in the Mkp-1+/+/Il-10−/− tissue (Student's t-test). B: activities of distinct MAPKs. The active forms of MAPKs in the tissue homogenates were detected by Western blot analyses, using antibodies against phospho-MAPKs. Comparable protein loading was verified by Western blot analysis using an antibody against β-actin (bottom). Presented are the representative results of at least 3 experiments.
Fig. 8.
Fig. 8.
Effects of Mkp-1 and Il-10 knockout on the production of TNF-α and IL-6 in innate immune cells during the response to LPS. Splenocytes and mesenteric lymph node cells were isolated from Mkp-1+/+/Il-10+/+, Mkp-1−/−/Il-10+/+, Mkp-1+/+/Il-10−/−, and Mkp-1−/−/Il-10−/− mice. Cells were treated with LPS (100 ng/ml) for 24 h. Concentrations of TNF-α and IL-6 in the media were assayed by ELISA. A: cytokine production by splenocytes. B: cytokine production by mesenteric lymph node cells. Data are presented as the means ± SE of at least 3 independent experiments. *P < 0.05, compared with LPS-stimulated cytokine production in wild-type cells. ‡P < 0.05, compared with LPS-stimulated cytokine production in Mkp-1+/+/Il-10+/+ cells (Student's t-test).
Fig. 9.
Fig. 9.
Effects of Mkp-1 and Il-10 knockout on Th-1 cytokine production in innate immune cells during the response to LPS. Splenocytes and lymph node cells were isolated from Mkp-1+/+/Il-10+/+, Mkp-1−/−/Il-10+/+, Mkp-1+/+/Il-10−/−, and Mkp-1−/−/Il-10−/− mice. Cells were treated with LPS (100 ng/ml) for 24 h. Total RNA was harvested to examine the expression of IL-12 subunits. A: IL-12 (p70) and IFN-γ production in response to LPS by splenocytes and lymph node cells isolated from Mkp-1+/+/Il-10+/+, Mkp-1−/−/Il-10+/+, Mkp-1+/+/Il-10−/−, and Mkp-1−/−/Il-10−/− mice. Concentrations of IL-12 (p70) and IFN-γ in the media were assayed by ELISA. B: Il-12 p35 mRNA expression in unstimulated and LPS-stimulated splenocytes. Il-12 p35 mRNA expression was detected by Northern blot analysis, using a murine Il-12 p35 cDNA. The blot was stripped and reprobed with a cDNA of murine Gapdh to normalize RNA loading. The intensity of the Il-12 p35 signal was quantified by use of the ImageQuant system, normalized to Gapdh signal, and presented in the graph. Data shown are results from a representative experiment. The level of Il-12 p35 mRNA in unstimulated Mkp-1+/+/Il-10+/+ splenocytes was set as 1. C: Il-12 p40 mRNA expression in unstimulated and LPS-stimulated splenocytes. Il-12 p40 expression was assessed by real-time RT-PCR. The level of Il-12 p40 mRNA in unstimulated Mkp-1+/+/Il-10+/+ splenocytes was set as 1. Data were presented as means ± SE of at least 3 independent experiments. *P < 0.05, compared with LPS-stimulated level in Mkp-1+/+/Il-10+/+ splenocytes; ‡P < 0.05, compared with LPS-stimulated level in Mkp-1+/+/Il-10−/− splenocytes (Student's t-test).
Fig. 10.
Fig. 10.
Characterization of mesenteric lymph node and intraepithelial T cells. Mice were housed in SPF environment and euthanized at 12 wk of age. Lymphocytes were isolated from mesenteric lymph nodes and epithelium through Percoll gradient centrifugation. Lymphocytes were activated with PMA and a calcium ionophore for 4 h in the presence of BD GolgiPlug. Cells were then fixed, stained with antibodies against CD3, CD4, IFN-γ, and IL-17, and analyzed by flow cytometry. A: quantification of Th-1 and Th-17 cells in mesenteric lymph nodes. B: quantification of Th-1 and Th-17 cells in intraepithelial lymphocytes. Representative flow cytometry plots are shown on the left with the cells of interest defined in the rectangles. The percentage of Th-1 and Th-17 cells are presented in the graph on the right as means ± SE of 3 to 4 animals. *P < 0.05, compared with Mkp-1+/+/Il-10−/− samples (Student's t-test).

Similar articles

Cited by

References

    1. Anderson CA, Boucher G, Lees CW, Franke A, D'Amato M, Taylor KD, Lee JC, Goyette P, Imielinski M, Latiano A, Lagace C, Scott R, Amininejad L, Bumpstead S, Baidoo L, Baldassano RN, Barclay M, Bayless TM, Brand S, Buning C, Colombel JF, Denson LA, de Vos M, Dubinsky M, Edwards C, Ellinghaus D, Fehrmann RS, Floyd JA, Florin T, Franchimont D, Franke L, Georges M, Glas J, Glazer NL, Guthery SL, Haritunians T, Hayward NK, Hugot JP, Jobin G, Laukens D, Lawrance I, Lemann M, Levine A, Libioulle C, Louis E, McGovern DP, Milla M, Montgomery GW, Morley KI, Mowat C, Ng A, Newman W, Ophoff RA, Papi L, Palmieri O, Peyrin-Biroulet L, Panes J, Phillips A, Prescott NJ, Proctor DD, Roberts R, Russell R, Rutgeerts P, Sanderson J, Sans M, Schumm P, Seibold F, Sharma Y, Simms LA, Seielstad M, Steinhart AH, Targan SR, van den Berg LH, Vatn M, Verspaget H, Walters T, Wijmenga C, Wilson DC, Westra HJ, Xavier RJ, Zhao ZZ, Ponsioen CY, Andersen V, Torkvist L, Gazouli M, Anagnou NP, Karlsen TH, Kupcinskas L, Sventoraityte J, Mansfield JC, Kugathasan S, Silverberg MS, Halfvarson J, Rotter JI, Mathew CG, Griffiths AM, Gearry R, Ahmad T, Brant SR, Chamaillard M, Satsangi J, Cho JH, Schreiber S, Daly MJ, Barrett JC, Parkes M, Annese V, Hakonarson H, Radford-Smith G, Duerr RH, Vermeire S, Weersma RK, Rioux JD. Meta-analysis identifies 29 additional ulcerative colitis risk loci, increasing the number of confirmed associations to 47. Nat Genet 43: 246– 252, 2011 - PMC - PubMed
    1. Ardizzone S, Puttini PS, Cassinotti A, Porro GB. Extraintestinal manifestations of inflammatory bowel disease. Dig Liver Dis 40, Suppl 2: S253– S259, 2008 - PubMed
    1. Asadullah K, Sterry W, Volk HD. Interleukin-10 therapy—review of a new approach. Pharmacol Rev 55: 241– 269, 2003 - PubMed
    1. Barrett JC, Hansoul S, Nicolae DL, Cho JH, Duerr RH, Rioux JD, Brant SR, Silverberg MS, Taylor KD, Barmada MM, Bitton A, Dassopoulos T, Datta LW, Green T, Griffiths AM, Kistner EO, Murtha MT, Regueiro MD, Rotter JI, Schumm LP, Steinhart AH, Targan SR, Xavier RJ, Libioulle C, Sandor C, Lathrop M, Belaiche J, Dewit O, Gut I, Heath S, Laukens D, Mni M, Rutgeerts P, Van Gossum A, Zelenika D, Franchimont D, Hugot JP, de Vos M, Vermeire S, Louis E, Cardon LR, Anderson CA, Drummond H, Nimmo E, Ahmad T, Prescott NJ, Onnie CM, Fisher SA, Marchini J, Ghori J, Bumpstead S, Gwilliam R, Tremelling M, Deloukas P, Mansfield J, Jewell D, Satsangi J, Mathew CG, Parkes M, Georges M, Daly MJ. Genome-wide association defines more than 30 distinct susceptibility loci for Crohn's disease. Nat Genet 40: 955– 962, 2008 - PMC - PubMed
    1. Baumgart DC, Sandborn WJ. Inflammatory bowel disease: clinical aspects and established and evolving therapies. Lancet 369: 1641– 1657, 2007 - PubMed

Publication types

MeSH terms

LinkOut - more resources