Clinical Trial
. 2012 May 1;188(9):4543-57.
doi: 10.4049/jimmunol.1103114. Epub 2012 Mar 28.

Intracellular heat shock protein-70 negatively regulates TLR4 signaling in the newborn intestinal epithelium

Affiliations
Clinical Trial

Intracellular heat shock protein-70 negatively regulates TLR4 signaling in the newborn intestinal epithelium

Amin Afrazi et al. J Immunol. .

Abstract

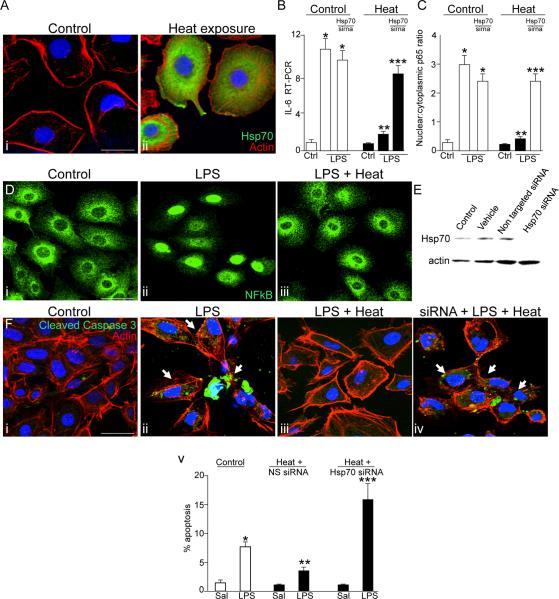
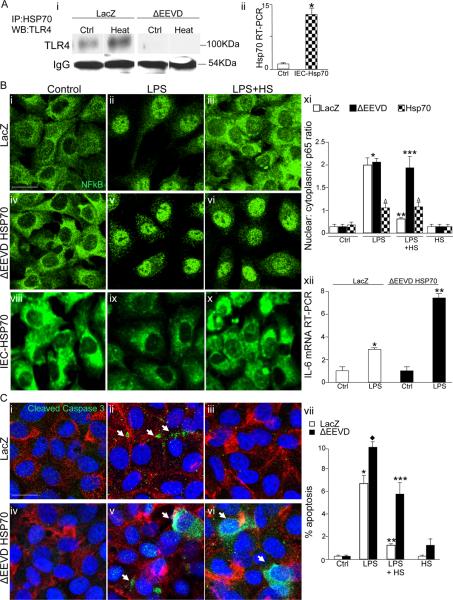
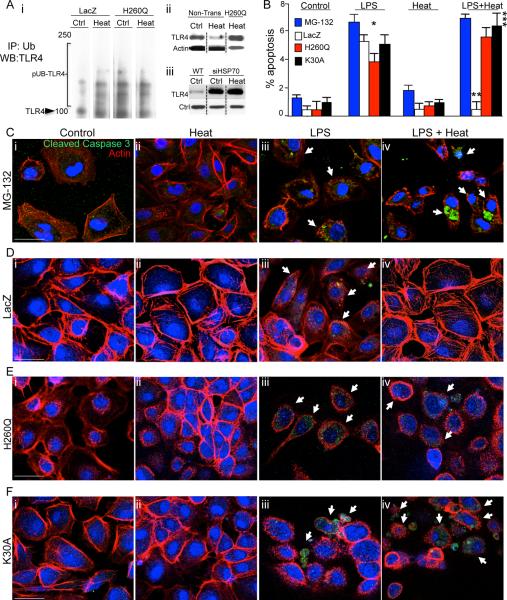
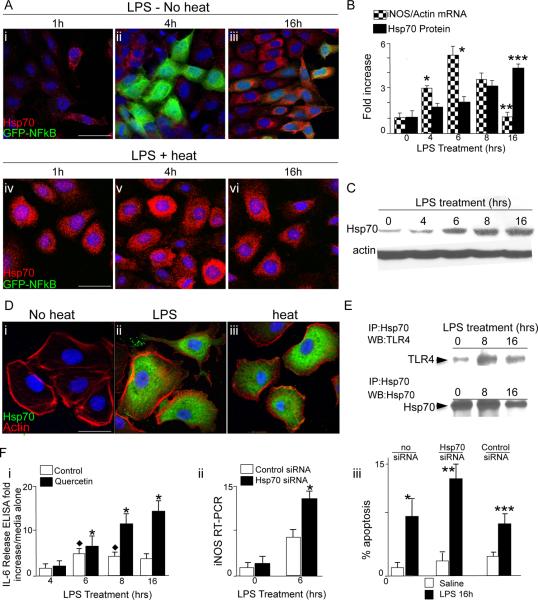
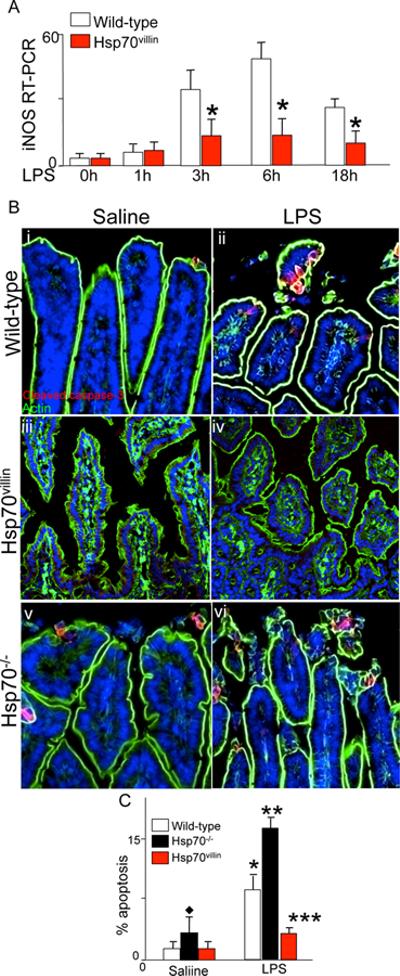
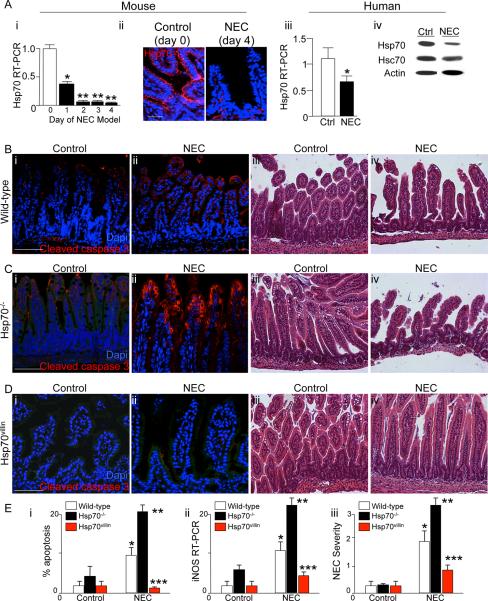
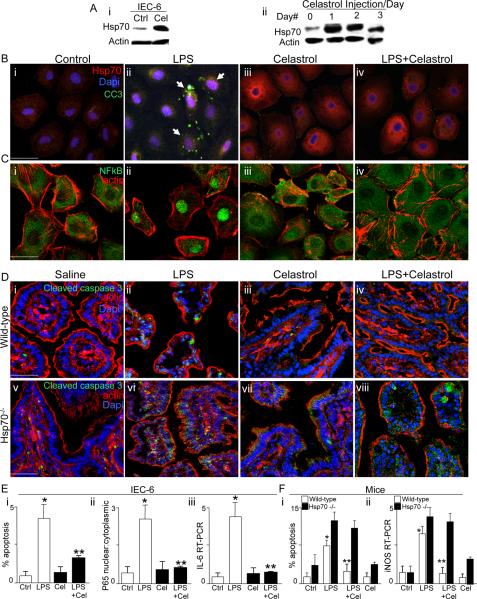
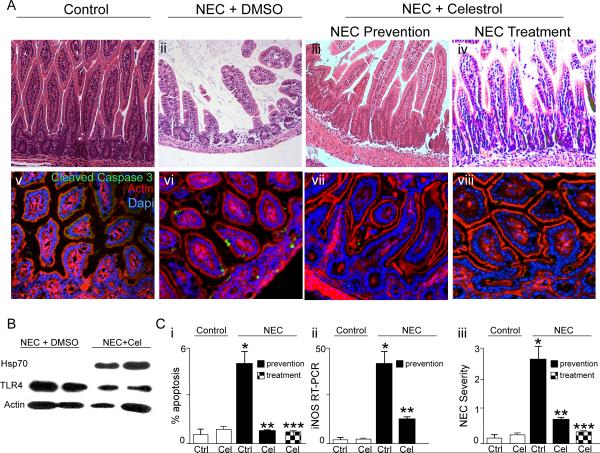
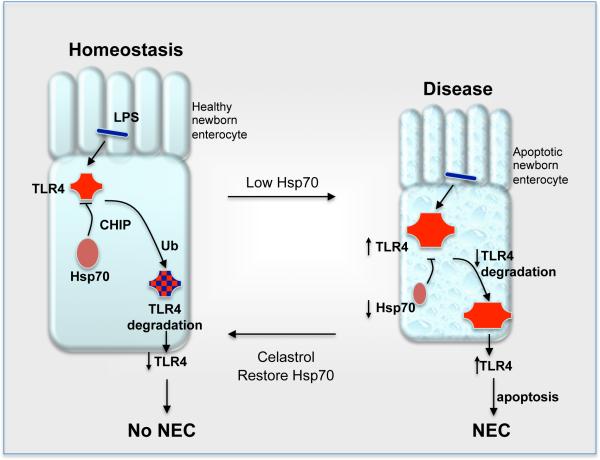
Necrotizing enterocolitis (NEC) is the leading cause of gastrointestinal-related mortality in premature infants, and it develops under conditions of exaggerated TLR4 signaling in the newborn intestinal epithelium. Because NEC does not develop spontaneously, despite the presence of seemingly tonic stimulation of intestinal TLR4, we hypothesized that mechanisms must exist to constrain TLR4 signaling that become diminished during NEC pathogenesis and focused on the intracellular stress response protein and chaperone heat shock protein-70 (Hsp70). We demonstrate that the induction of intracellular Hsp70 in enterocytes dramatically reduced TLR4 signaling, as assessed by LPS-induced NF-κB translocation, cytokine expression, and apoptosis. These findings were confirmed in vivo, using mice that either globally lacked Hsp70 or overexpressed Hsp70 within the intestinal epithelium. TLR4 activation itself significantly increased Hsp70 expression in enterocytes, which provided a mechanism of autoinhibition of TLR4 signaling in enterocytes. In seeking to define the mechanisms involved, intracellular Hsp70-mediated inhibition of TLR4 signaling required both its substrate-binding EEVD domain and association with the cochaperone CHIP, resulting in ubiquitination and proteasomal degradation of TLR4. The expression of Hsp70 in the intestinal epithelium was significantly decreased in murine and human NEC compared with healthy controls, suggesting that loss of Hsp70 protection from TLR4 could lead to NEC. In support of this, intestinal Hsp70 overexpression in mice and pharmacologic upregulation of Hsp70 reversed TLR4-induced cytokines and enterocyte apoptosis, as well as prevented and treated experimental NEC. Thus, a novel TLR4 regulatory pathway exists within the newborn gut involving Hsp70 that may be pharmacologically activated to limit NEC severity.


Figures

Figure 1
Figure 1. Hsp70 induction limits TLR4 signaling in enterocytes
A: Confocal micrographs showing the expression of Hsp70 (green), β-actin (red) and DAPI (blue) in IEC-6 enterocytes that were either untreated (i) or exposed to 42°C for 45 minutes (ii). B–C: quantitative RT-PCR showing the expression of IL-6 (B) or quantification of the extent of NFkB translocation (C) in IEC-6 cells that were either untreated (white bars) or exposed to heat (black bars), and were either untransfected or were transfected with Hsp70 siRNA. *p<0.05 vs untreated control; **p<0.05 vs heat-control, ***p<0.001 vs control cells transfected with Hsp70 siRNA. D: Confocal micrographs of IEC-6 enterocytes that were either untreated (i), treated with LPS (50μg/ml, 45 min, ii) or were treated with LPS after pre-treatment with heat (iii). Quantification in C is based upon over 50 cells per field and over 50 fields examined in 4 separate experiments. *p<0.05 vs untreated control; **p<0.05 vs heat-control. E: Representative SDS-PAGE showing lysates of IEC-6 that were untreated (control), incubated with PBS alone (vehicle), or were transfected with either control siRNA against no known substrate (non-targeted siRNA) or siRNA to Hsp70 (Hsp70 siRNA). Blot was stripped then re-probed with antibodies to β-actin. F: confocal micrographs (i–iv) and quantification (v) of IEC-6 enterocytes that were either untreated (i), treated with LPS in the absence (ii) or presence of pre-exposure to heat as above (iii), or pre-treated 48 hours prior with siRNA to Hsp70 as in (iv). *p<0.05 vs control; **p<0.005 vs LPS control; ***p<0.05 vs heat+hsp70sirna saline. Representative images are taken of over 50 fields examined with over 50 cells/field in 4 separate experiments. Size bar = 10μ. Representative apoptotic cells are indicated by arrows.
Figure 2
Figure 2. An EEVD-mediated association between TLR4 and Hsp70 is required for the inhibition of TLR4 signaling in enterocytes by Hsp70
Ai: Representative SDS-PAGE showing lysates of IEC-6 enterocytes that had been virally transduced with either LacZ or Hsp70 lacking the EEVD substrate binding domain (ΔEEVD), prior to treatment with LPS and maintained at 37°C or treated at 42°C for 45 min (heat) then immunoprecipitated with antibodies to Hsp70 and immunoblotted with anti-TLR4 antibodies; shown is IgG as a loading control. Aii. Quantitative RT-PCR showing the expression of Hsp70 in nontransfected control IEC-6 cells and IEC-6 cells that were transfected with full length Hsp70. B–C: representative confocal micrographs of IEC-6 enterocytes that were either transduced with LacZ (B: i–iii, C: i–iii) or ΔEEVD-Hsp70 (B: iv-vi, C: iv-vi) then untreated (B i and iv, C i and iv), or LPS treated (B: ii and v, C: ii and v) or treated with LPS plus pre-treatment with heat (B: iii and vi, C: iii and vi). Cells were then stained with for NFkB (green in B), or cleaved-caspase 3 (green), β-actin (red) and DAPI (blue) in C. NFkB translocation (B xi) and % apoptosis (C vii) based upon at least 50 fields with over 50 cells/field; *p<0.05 LPS open and solid bars vs control open and solid bar; **p<0.05 LPS+HS vs LPS open bar, ***p<0.05 control black bar vs LPS+HS black bar. Diamond: p<0.05 LPS black bar vs LPS open bar; summary of 4 separate experiments. Shown in panels B viii–x are confocal micrographs of IEC-6 cells that were transfected with Hsp70 and treated as indicated; in xi Δ=no significant difference between untreated, LPS-treated or heat exposed LPS-treated Hsp70-IEC-6 cells. Shown in panel B xii: Quantitative RT-PCR showing IL-6 expression in IEC-6 cells that were transfected with Lac-Z or delta EEVD then treated with LPS as in Methods (6h, 50μg/ml). *p<0.05 vs ctrl, **p<0.05 vs LPS in Lac-Z transfected cells. Representative of 3 separate experiments. Size bar=10μ. Representative apoptotic cells are indicated by arrows.
Figure 3
Figure 3. The induction of Hsp70 leads to the ubiquitination and degradation of TLR4 via the co-chaperone CHIP
A i: Representative immunoblots in which LacZ and H260Q-transfected IEC-6 enterocytes were exposed to heat or were maintained at 37°C, then immunoprecipitated with anti-ubiquitin antibodies and immunoblotted with anti-TLR4 antibodies, displaying poly-ubiquitinated species (“pUB-TLR4”). The location of TLR4 on the gel is shown. ii: Representative SDS-PAGE of IEC-6 cells probed with anti-TLR4 antibodies that were either non-transfected or transfected with H260Q then maintained at 37°C or exposed to heat, in which heat exposure leads to a reduction in TLR4 expression that is not seen in H260Q-transfected cells. iii: SDS-PAGE showing expression of TLR4 and loading protein control in either wild-type (“WT”) IEC-6 cells or IEC-6 cells treated with siRNA to Hsp70 (“siHSP70”) that were either untreated (“Ctrl”) or treated with heat as in Methods (“Heat”). B–F: Representative confocal micrographs of IEC-6 enterocytes treated with MG-132 (C), or transduced with LacZ (D) or H260Q-CHIP (E) or K30A-CHIP (F) and treated as indicated and immuno-stained with cleaved-caspase 3 (green), β-actin (red) and DAPI (blue). Size bar = 10μ. Shown in (B) % apoptosis per HPF > 50 fields with over 50 cells/field.; *p<0.05 control (all bars) versus LPS (all bars); **p<0.05 LPS (open bar) versus LPS+Heat (open bar); vs LPS open bar, ***p<0.05 Control versus LPS + Heat (black, red and blue bars) in 3 separate experiments. Size bar=10μ. Arrows point to apoptotic cells in each group under the indicated treatment.
Figure 4
Figure 4. TLR4 induces Hsp70 expression which then negatively effects TLR4 signaling
A: Representative confocal micrographs of IEC-6 enterocytes transduced with GFPNFkB then treated with LPS (t=0) in the absence of heat (i–iii) or LPS after pre-treatment with heat (iv-vi); cells were stained for Hsp70(red) and assessed for GFP (green) at the indicated time point. B: Quantification of iNOS mRNA by RT-PCR (checkered bars) and Hsp70 protein (solid bars) relative to β-actin. *p<0.05 vs t=0 checkered bars; ** p<0.05 16h vs 8h, 6h and 4h, checkered bars. ***p<0.05 t=16h vs other time points, solid bars. In 4 separate experiments. C: Representative SDS-PAGE showing Hsp70 in IEC-6 cells treated with LPS. D: Representative confocal micrographs of IEC-6 enterocytes under the indicated conditions and stained for Hsp70 (green), β-actin (red) and DAPI (blue). E: Representative SDS-PAGE of IEC-6 lysates treated with LPS, immunoprecipitated with anti-Hsp70 antibodies and immunoblotted with TLR4 (upper bands) and Hsp70. Fi: Fold increase of IL-6 release by ELISA over media alone in IEC-6 treated as indicated. *p<0.005 solid bars vs open bars indicated point. Diamond: p<0.05 open bars vs 4h time point. Representative of 3 separate experiments ii: iNOS RT-PCR in IEC-6 cells treated with LPS as indicated. Representative of 4 separate experiments iii: Apoptosis in IEC-6 cells treated as indicated. *p<0.05 no siRNA solid vs open bars; **p<0.05 Hsp70 siRNA vs no siRNA solid bars; ***p<0.05 vs Hsp70 siRNA vs control siRNA, solid bars; based upon 4 separate experiments >50 fields/experiment and over 50 cells/field.
Figure 5
Figure 5. Hsp70 negatively regulates TLR4 signaling in the intestinal epithelium
A: RT-PCR for iNOS in the intestinal epithelium in wild-type (open bars) or Hsp70villin mice treated (red bar) with LPS for the time points indicated. *p<0.05 red bar vs open bar for each point indicated. B: confocal micrographs of newborn intestine obtained from the terminal ileum after injection with saline (B i, iii, iv) or LPS (5mg/kg, 16h B ii, iv, vi) in mice that were either wild-type (B iii), Hsp70villin (B iiiiv), or Hsp70−/− (B vvi). C: Quantification of apoptosis in the small intestine of newborn mice as in panels B after injection with saline or LPS as indicated. Based upon 4 separate experiments with over 4 mice per group and over 50 fields examined per group. *p<0.05 saline vs LPS for open and black bars; ** p<0.005 LPS white bar vs LPS solid bar; ***p<0.005 LPS red bar vs LPS solid bar; diamond: saline treated black bar versus open bar or red bar.
Figure 6
Figure 6. Hsp70 signaling negatively regulates the development of NEC
A: i: RT-PCR showing Hsp70 on each day of the 4-day NEC model; *p<0.05 vs day 0; *p<0.05 vs day 1. Representative of over 4 separate experiments, 10 mice/group; ii: Representative confocal micrographs showing the expression of Hsp70 (red) and DAPI (blue) in the terminal ileum of mice without (“control”) and with NEC (“NEC”). iii: PCR showing the expression of Hsp70 in intestine from infants without (open bar) and with NEC (solid bar); *p<0.05 solid vs open, based upon 9 separate samples per group; iv: representative SDS-PAGE from infant without (ctrl) and with NEC blotted with antibodies to Hsp70 then probed for Hsc70 and β-actin; BD: Representative confocal and H&E micrographs of sections of the terminal ileum from newborn mice with and without NEC that were either wild-type (B), Hsp70−/− (C) and Hsp70villin (D). In panels B iii, C iii, D iii, slides were stained for cleaved-caspase 3 (red) and DAPI (blue). E: i apoptosis, ii: iNOS RT-PCR in the terminal ileum; iii: NEC severity. *p<0.05 NEC in wild-type vs control; **p<0.005 NEC in Hsp70−/− vs wild type; *** NEC in Hsp70villin vs wild-type and Hsp70−/−. Based upon at least 4 experiments with over 15 mice per strain per group. Size bar=250μm.
Figure 7
Figure 7. Pharmacologic induction of Hsp70 limits TLR4 signaling in enterocytes in vitro and in vivo
A: i: Representative SDS-PAGE of IEC-6 enterocytes treated with Celastrol or DMSO and blotted with Hsp70 then re-probed for β-actin; ii: Representative SDS-PAGE of mucosal scrapings from terminal ileum of newborn mice administered Celastrol daily for 3 days. BC: Representative confocal micrographs of IEC-6 enterocytes treated as indicated and immunostained for Hsp70 (red in B) and DAPI (blue in B) or NFkB (green in C) and β-actin (red in C). Size bar=10 mm. D: Representative confocal micrographs of terminal ileum in newborn wild-type (iiv) or Hsp70−/− mice (vviii) that were treated as indicated as indicated and stained for cleaved-caspase 3 (green), DAPI (blue) and β-actin (red). Size bar=250 mm. E: quantification in IEC-6 as indicated. *p<0.05 control vs LPS open bars; ** LPS open bars vs LPS+Celastrol closed bars in 4 separate experiments. F: Quantification of apoptosis (i) and iNOS expression (ii) by RTPCR in the terminal ileum of the newborn wild-type (open bars) or Hsp70−/− mice mouse as indicated. *p<0.05 open bars LPS vs control, **p<0.05 LPS + Celastrol vs LPS open bars; representative of 4 separate experiments, over 10 mice/group. Representative apoptotic cells are indicated by arrows.
Figure 8
Figure 8. Pharmacologic induction of Hsp70 prevents and also treats experimental necrotizing enterocolitis in mice
A: Representative H&E (iiv) or confocal images (vviii, cleaved-caspase 3 (green), β-actin (red) DAPI (blue)) of sections from terminal ileum of newborn mice that were either breast fed (“control”, Ai and Av), or induced to develop NEC and administered either DMSO (Aii, Avi) or Celastrol (1mg/kg on day 0 and 1 of the 4 day model, Aiii and Avii). In parallel, mice that had NEC for 2 days were administered Celastrol (1mg/kg for 2 days, Aiv and Aviii). Size bar=250μm. B: SDS-PAGE of mucosal scrapings from mice subjected to experimental NEC and injected with either DMSO or Celastrol on the first two days of the model; blots were probed for Hsp70 then stripped and re-probed for TLR4 and β-actin. C: Quantification of enterocyte apoptosis (Ci), iNOS by RT-PCR in the terminal ileum (Cii), and NEC severity (Ciii) under the indicated condition. *p<0.05 NEC Ctrl (solid bar) vs control (open bar), **p<0.05 NEC Celastrol – prevention (solid bar) vs NEC control (solid bar); ***p<0.005 NEC Celastrol-treatment (checkered bar) vs NEC control (solid bar); representative of 4 separate experiments> 10 mice/group.
Figure 9
Figure 9. Proposed model: Hsp70 regulates TLR4 signaling in enterocytes in the pathogenesis of NEC
As described in the text, under healthy conditions (left cell), TLR4 is activated by host microbes. The degree of activation is limited by Hsp70 through effects on TLR4 degradation through proteosomal pathways via CHIP. By contrast, under the conditions of stress that favor the development of NEC (right cell), the reduction in Hsp70 expression accompanied by the increase in TLR4 expression leads to exaggerated TLR4 activation and the development of the increased enterocyte apoptosis and pro-inflammatory cytokine expression in the newborn intestine. This leads to the development of NEC. Moreover, pharmacologic induction of Hsp70 can curtail TLR4 signaling and both prevent and treat experimental NEC.

References

    1. Neu J, Walker WA. Necrotizing enterocolitis. N Engl J Med. 2011;363:255–264. - PMC - PubMed
    1. Afrazi A, Sodhi CP, Richardson W, Neal M, Good M, Siggers R, Hackam DJ. New insights into the pathogenesis and treatment of necrotizing enterocolitis: toll-like receptors and beyond. Pediatr Res. 2011;69:183–188. - PMC - PubMed
    1. Leaphart CL, Cavallo JC, Gribar SC, Cetin S, Li J, Branca MF, Dubowski TD, Sodhi CP, Hackam DJ. A critical role for TLR4 in the pathogenesis of necrotizing enterocolitis by modulating intestinal injury and repair. J. Immunol. 2007;179:4808–4820. - PubMed
    1. Sodhi CP, Shi XH, Richardson WM, Grant ZS, Shapiro RA, Prindle TJ, Branca M, Russo A, Gribar SC, Ma C, Hackam DJ. Toll-like Receptor-4 Inhibits Enterocyte Proliferation via Impaired beta-Catenin Signaling in Necrotizing Enterocolitis. Gastroenterology. 2010;138:185–196. - PMC - PubMed
    1. Jilling T, Simon D, Lu J, Meng FJ, Li D, Schy R, Thomson RB, Soliman A, Arditi M, Caplan MS. The roles of bacteria and TLR4 in rat and murine models of necrotizing enterocolitis. J Immunol. 2006;177:3273–3282. - PMC - PubMed

Publication types

MeSH terms