. 2012 Mar 22:6:15.
doi: 10.3389/fncir.2012.00015. eCollection 2012.

Two-photon scanning microscopy of in vivo sensory responses of cortical neurons genetically encoded with a fluorescent voltage sensor in rat

Affiliations

Two-photon scanning microscopy of in vivo sensory responses of cortical neurons genetically encoded with a fluorescent voltage sensor in rat

Kurt F Ahrens et al. Front Neural Circuits. .

Abstract

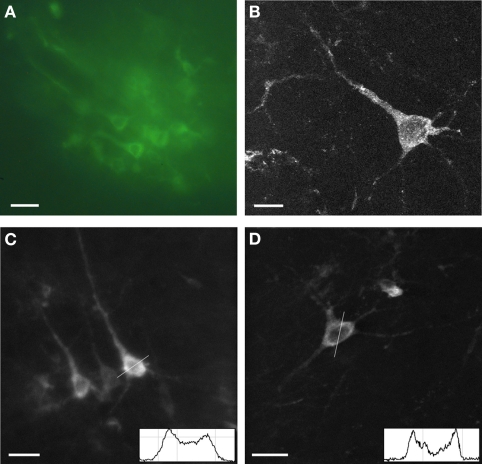
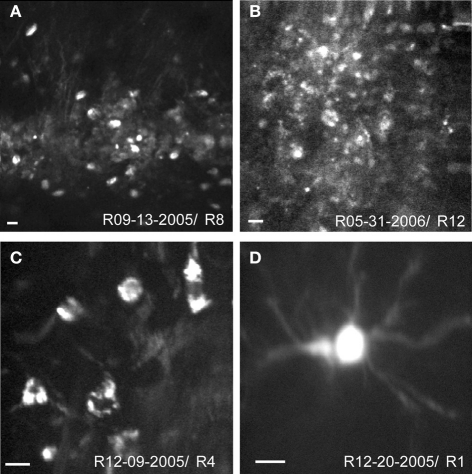
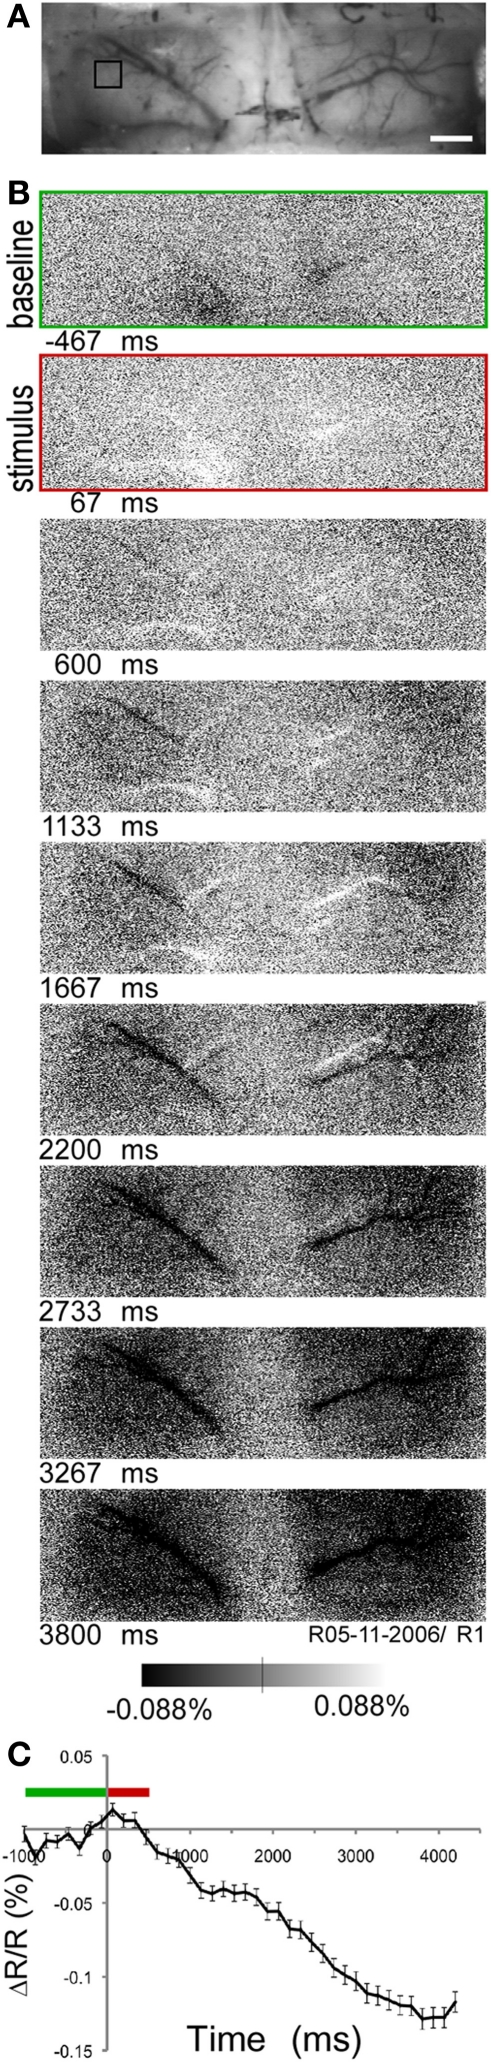
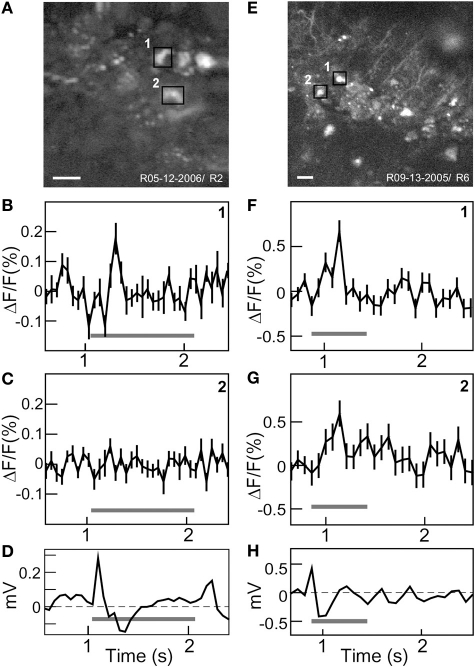
A fluorescent voltage sensor protein "Flare" was created from a Kv1.4 potassium channel with YFP situated to report voltage-induced conformational changes in vivo. The RNA virus Sindbis introduced Flare into neurons in the binocular region of visual cortex in rat. Injection sites were selected based on intrinsic optical imaging. Expression of Flare occurred in the cell bodies and dendritic processes. Neurons imaged in vivo using two-photon scanning microscopy typically revealed the soma best, discernable against the background labeling of the neuropil. Somatic fluorescence changes were correlated with flashed visual stimuli; however, averaging was essential to observe these changes. This study demonstrates that the genetic modification of single neurons to express a fluorescent voltage sensor can be used to assess neuronal activity in vivo.

Keywords: cortex; genetic engineering; single cell; two-photon imaging; vision.


Figures

Figure 1
Figure 1
Expression of Sindbis Flare in fixed tissue. (A) Fluorescence microscope image of field of labeled neurons. (B) High power confocal image of a single neuron transfected with Flare (10 μm stack, 0.5 micron sections). (C,D) Confocal images of labeled neurons. No more than third-order dendrites are labeled. Insets show gray scale profiles (membrane brightness relative to cell plasma: 44%, A; 83%, B; distance; 25 μm) across selected cell bodies. Scale bars, 10 μm (A), 5 μm (B), 20 μm (C,D).
Figure 2
Figure 2
In vivo structural two-photon scanning of Sindbis Flare transfected neurons in rat visual cortex. (A,B) Labeled cell bodies and neuropil at low magnification. (C,D) High magnification images of soma and dendrites. Scale bars, 10 μm. Depth of scanning for each example was 90 μm (A), 100 μm (B), 120 μm (C), 340 μm (D).
Figure 3
Figure 3
Intrinsic optical imaging of rat visual cortex. (A) Image taken under green (540 nm) light to visualize vasculature over visual cortex through thinned skull. Scale bar, 1 mm. (B) Time series of intrinsic images taken at 7 Hz under orange (605 nm) light. First image, baseline period (green); second image, visual stimulation period (red) (C) Time course (mean ± standard error) of intrinsic signal in region of interest indicated in (A, black square). Green bar, baseline period; red bar, stimulation period (stimulus onset at time 0).
Figure 4
Figure 4
In vivo functional two-photon scanning of Sindbis Flare transfected neurons in rat visual cortex. (A) High resolution (256 × 256) structural scan of first site with multiple labeled neurons with two ROIs (black squares) delimited. (B,C) Averaged fluorescence signal (mean ± standard error) from each ROI. Cell 1 responded to stimulus onset (B), cell 2 did not respond (C). Graphs (D) Visually evoked potentials from surface electrode. (E) High resolution (512 × 512) structural scan of second site showing labeled cell bodies and processes. Two neighboring cells are marked (black squares). (F,G) Averaged fluorescence signal (mean ± standard error) for cell 1 and 2 that both show significant responses. (H) Visually evoked potentials. Gray bars in (B–D, F–H) indicate ON stimulus period. Scale bars: 20 μm.

References

    1. Ahrens K. F., Freeman W. J. (2001). Response dynamics of entorhinal cortex in awake, anesthetized, and bulbotomized rats. Brain Res. 911, 193–202 10.1016/S0006-8993(01)02687-7 - DOI - PubMed
    1. Akemann W., Mutoh H., Perron A., Rossier J., Knöpfel T. (2010). Imaging brain electric signals with genetically targeted voltage-sensitive fluorescent proteins. Nat. Methods 7, 643–649 10.1038/nmeth.1479 - DOI - PubMed
    1. Ataka K., Pieribone V. A. (2002). A genetically targetable fluorescent probe of channel gating with rapid kinetics. Biophys. J. 82, 509–516 10.1016/S0006-3495(02)75415-5 - DOI - PMC - PubMed
    1. Bailey C. J., Sanganahalli B. G., Herman P., Blumenfeld H., Gjedde A., Hyder F. (2012). Analysis of time and space invariance of BOLD responses in the rat visual system. Cereb. Cortex. [Epub ahead of print] 10.1093/cercor/bhs008 - DOI - PMC - PubMed
    1. Baker B., Mutoh H., Dimitrov D., Akemann W., Perron A., Iwamoto Y., Jin L., Cohen L., Isacoff E., Pieribone V., Hughes T., Knöpfel T. (2008). Genetically encoded fluorescent sensors of membrane potential. Brain Cell Biol. 36, 53–67 10.1007/s11068-008-9026-7 - DOI - PMC - PubMed

LinkOut - more resources