

Integrating intracellular dynamics using CompuCell3D and Bionetsolver: applications to multiscale modelling of cancer cell growth and invasion
- PMID: 22461894
- PMCID: PMC3312894
- DOI: 10.1371/journal.pone.0033726
Integrating intracellular dynamics using CompuCell3D and Bionetsolver: applications to multiscale modelling of cancer cell growth and invasion
Abstract
In this paper we present a multiscale, individual-based simulation environment that integrates CompuCell3D for lattice-based modelling on the cellular level and Bionetsolver for intracellular modelling. CompuCell3D or CC3D provides an implementation of the lattice-based Cellular Potts Model or CPM (also known as the Glazier-Graner-Hogeweg or GGH model) and a Monte Carlo method based on the metropolis algorithm for system evolution. The integration of CC3D for cellular systems with Bionetsolver for subcellular systems enables us to develop a multiscale mathematical model and to study the evolution of cell behaviour due to the dynamics inside of the cells, capturing aspects of cell behaviour and interaction that is not possible using continuum approaches. We then apply this multiscale modelling technique to a model of cancer growth and invasion, based on a previously published model of Ramis-Conde et al. (2008) where individual cell behaviour is driven by a molecular network describing the dynamics of E-cadherin and β-catenin. In this model, which we refer to as the centre-based model, an alternative individual-based modelling technique was used, namely, a lattice-free approach. In many respects, the GGH or CPM methodology and the approach of the centre-based model have the same overall goal, that is to mimic behaviours and interactions of biological cells. Although the mathematical foundations and computational implementations of the two approaches are very different, the results of the presented simulations are compatible with each other, suggesting that by using individual-based approaches we can formulate a natural way of describing complex multi-cell, multiscale models. The ability to easily reproduce results of one modelling approach using an alternative approach is also essential from a model cross-validation standpoint and also helps to identify any modelling artefacts specific to a given computational approach.
Conflict of interest statement
Figures


 -catenin concentrations eventually drop, causing cells that are close to each other to undergo re-attachment (MET) while other cells that are not close remain as mesenchymal cells. Colours of the cells correspond to concentration of
  -catenin.
 times until
  MCS.
MCS.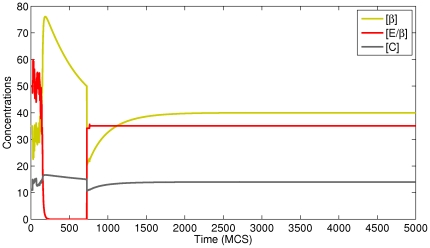

 -catenin concentration.
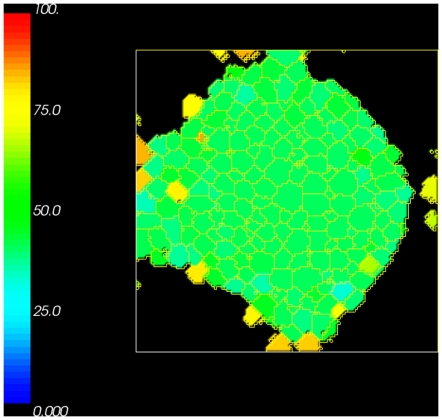
 -catenin is lower than the cells at the outer layer of tumour mass that have fewer binding neighbours and a high concentration of free
  -catenin.
 was varied between high, intermediate and low values and the number of cells that detach and migrate a certain distance from the tumour mass was monitored.

 .
.
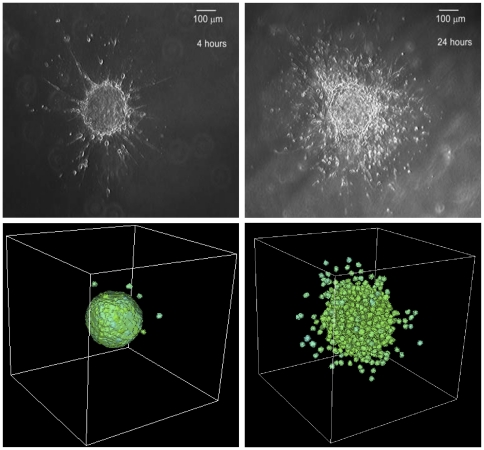
 and bottom left figure with
  ) are comparable to the experimental data. The simulation results were taken at
  MCS. Reprinted from Biophysical Journal, 89/1, L. Kaufman, C. Brangwynne, K. Kasza, E. Filippidi, V. Gordon, T. Deisboeck, and D. Weitz, Glioma expansion in collagen I matrices: analyzing collagen concentration-dependent growth and motility patterns, 635–650, Copyright (2005), with permission from Elsevier [OR APPLICABLE SOCIETY COPYRIGHT OWNER].
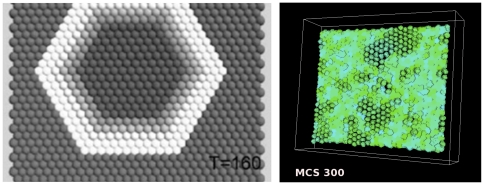

 attempts to replace the “grey” pixel (target) of cell with
  . The probability of accepting the index copy is given by equation (1). Bold lines denote boundaries of the cells. Pixel colour denotes cell type. Notice that in GGH simulations we typically have multiple cells with different id
  but belonging to the same type
  .
.
References
-
- Preziosi L. Cancer Modelling and Simulation. Chapman & Hall/CRC Press; 2003.
-
- Bellomo N, Angelis ED, Preziosi L. Multiscale modeling and mathematical problems related to tumour evolution and medical therapy. J Theor Med. 2003;5:111–136.
-
- Alarcón T, Byrne H, Maini P. A multiple scale model for tumor growth. Multiscale Model Simul. 2005;3:440–475.
-
- Athale C, Deisboeck T. The effects of egf-receptor density on multiscale tumor growth patterns. J Theor Biol. 2006;238:771–779. - PubMed
Publication types
MeSH terms
Substances
Grants and funding
LinkOut - more resources
Full Text Sources
Miscellaneous
