. 2012:2:335.
doi: 10.1038/srep00335. Epub 2012 Mar 29.

Competition among memes in a world with limited attention

Competition among memes in a world with limited attention

L Weng et al. Sci Rep. 2012.

Abstract

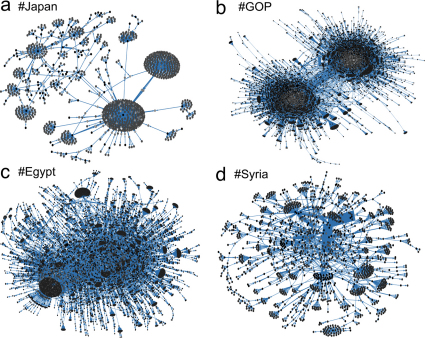
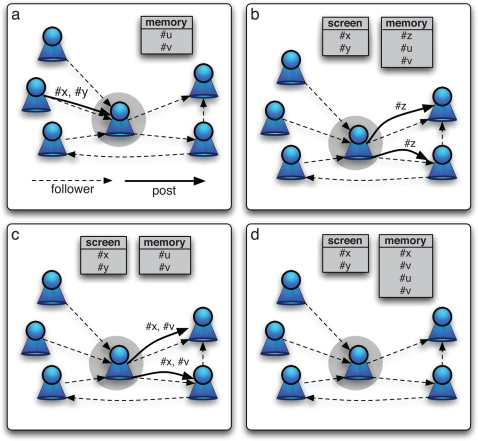
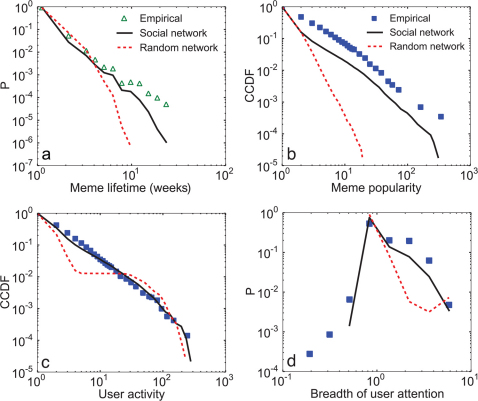
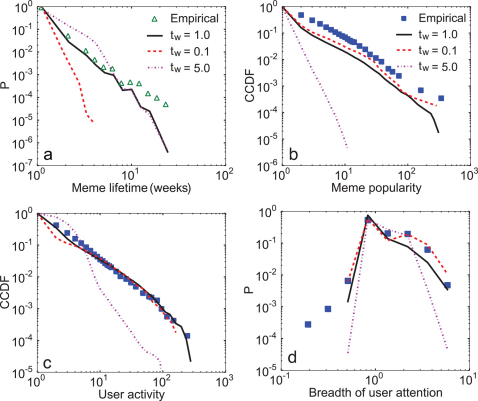
The wide adoption of social media has increased the competition among ideas for our finite attention. We employ a parsimonious agent-based model to study whether such a competition may affect the popularity of different memes, the diversity of information we are exposed to, and the fading of our collective interests for specific topics. Agents share messages on a social network but can only pay attention to a portion of the information they receive. In the emerging dynamics of information diffusion, a few memes go viral while most do not. The predictions of our model are consistent with empirical data from Twitter, a popular microblogging platform. Surprisingly, we can explain the massive heterogeneity in the popularity and persistence of memes as deriving from a combination of the competition for our limited attention and the structure of the social network, without the need to assume different intrinsic values among ideas.


Figures

Figure 1
Figure 1. Visualizations of meme diffusion networks for different topics.
Nodes represent Twitter users, and directed edges represent retweeted posts that carry the meme. The brightness of a node indicates the activity (number of retweets) of a user, and the weight of an edge reflects the number of retweets between two users. (a) The #Japan meme shows how news about the March 2011 earthquake propagated. (b) The #GOP tag stands for the US Republican Party and as many political memes, displays a strong polarization between people with opposing views. Memes related to the “Arab Spring” and in particular the 2011 uprisings in (c) #Egypt and (d) #Syria display characteristic hub users and strong connections, respectively.
Figure 2
Figure 2. Plot of daily system entropy (solid red line) and average user breadth of attention (dashed blue line).
Days in our observation period are ranked from low to high system entropy, therefore the latter is monotonously increasing.
Figure 3
Figure 3. Relationship between the probability of retweeting a message and its similarity to the user interests, inferred from prior posting behavior.
Figure 4
Figure 4. Empirical regularities in Twitter data.
(a) Probability distribution of the lifetime of a meme using hours (red circles), days (blue squares), and weeks (green triangles) as time units. In the plot, units are converted into hours. Since the distributions are well approximated by a power law, we can align the curves by rescaling the y-axis by λα, where λ is the ratio of the time units (e.g., λ = 24 for rescaling days into hours) and α ≈ 2.5 is the exponent of the power law (via maximum likelihood estimation33). This demonstrates that the shape of the lifetime distribution is not an artifact of the time unit chosen to define the lifetime. (b) Complementary cumulative probability distribution of the popularity of a meme, measured by the total number of users per day who have used that meme. This and the following measures were performed daily (filled red circles), weekly (filled blue squares), and monthly (filled green triangles). (c) Complementary cumulative probability distribution of user activity, measured by the number of messages per day posted by a user. (d) Probability distribution of breadth of user attention (entropy), based on the memes tweeted by a user. Note that the larger the number of posts produced, the smaller the non-zero entropy values recorded for users who focus on a small set of memes. This explains why the distributions for longer periods of time extend further to the left.
Figure 5
Figure 5. Illustration of the meme diffusion model.
Each user has a memory and a screen, both with limited size. (a) Memes are propagated along follower links. (b) The memes received by a user appear on the screen. With probability pn, the user posts a new meme, which is stored in memory. (c) Otherwise, with probability 1 – pn, the user scans the screen. Each meme x in the screen catches the user's attention with probability pr. Then with probability pm a random meme from memory is triggered, or x is retweeted with probability 1 – pm. (d) All memes posted by the user are also stored in memory.
Figure 6
Figure 6. Evaluation of model by comparison of simulations with empirical data (same panels and symbols as in Fig. 4).
To study the role played by the network structure in the meme diffusion process, we simulate the model on the sampled follower network (solid black line) and a random network (dashed red line). Both networks have 105 nodes and about 3 × 10⁶ edges. (a) The definition of lifetime uses the week as time unit. (b,c,d) Meme popularity, user activity, and user entropy data are based on weekly measures.
Figure 7
Figure 7. Evaluation of model by comparison of simulations with empirical data (same panels and symbols as in Fig. 4).
To study the role of meme competition, we simulate the model on the sampled follower network with different levels of competition; posts are removed from screen and memory after tw time units. We compare the standard model (tw = 1, solid black line) against versions with less competition (tw = 5, dot-dashed magenta line) and more competition (tw = 0.1, dashed red line). (a) The definition of lifetime uses the week as time unit. (b,c,d) Meme popularity, user activity, and user entropy data are based on weekly measures.

References

    1. Davenport T. H. & Beck J. C. The Attention Economy: Understanding the New Currency of Business (Harvard Business School Press, 2001).
    1. Tapscott D. & Williams A. D. Wikinomics: How Mass Collaboration Changes Everything (Portfolio Hardcover, 2006).
    1. Dawkins R. The selfish gene (Oxford University Press, 1989).
    1. Simon H. Designing organizations for an information-rich world. In: Greenberger M. (ed.) Computers, Communication, and the Public Interest, 37–52 (The Johns Hopkins Press, Baltimore, 1971).
    1. Goldhaber M. H. The attention economy and the net. First Monday 2 (1997).