. 2012 May;35(9):1381-95.
doi: 10.1111/j.1460-9568.2012.08056.x. Epub 2012 Mar 30.

Endogenously released ACh and exogenous nicotine differentially facilitate long-term potentiation induction in the hippocampal CA1 region of mice

Affiliations

Endogenously released ACh and exogenous nicotine differentially facilitate long-term potentiation induction in the hippocampal CA1 region of mice

Sakura Nakauchi et al. Eur J Neurosci. 2012 May.

Abstract

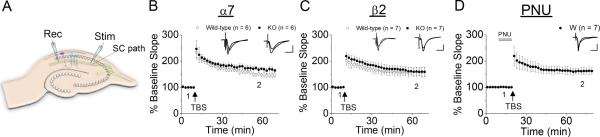
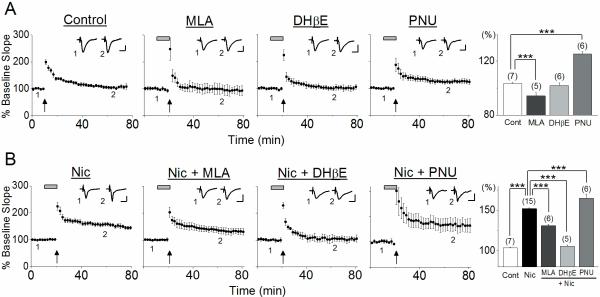
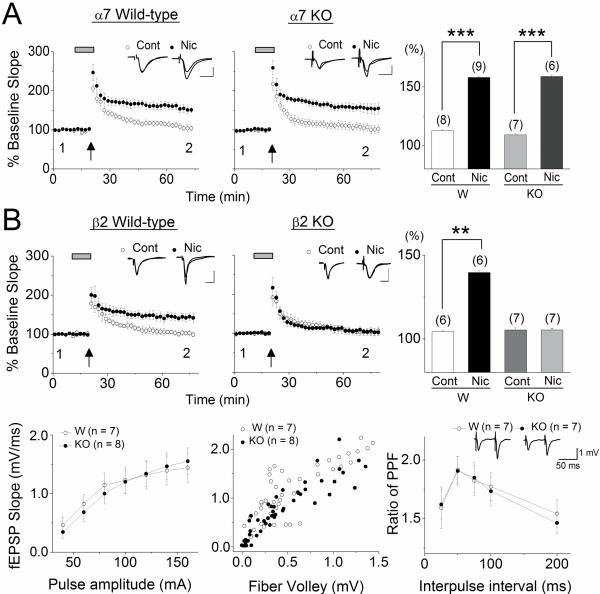
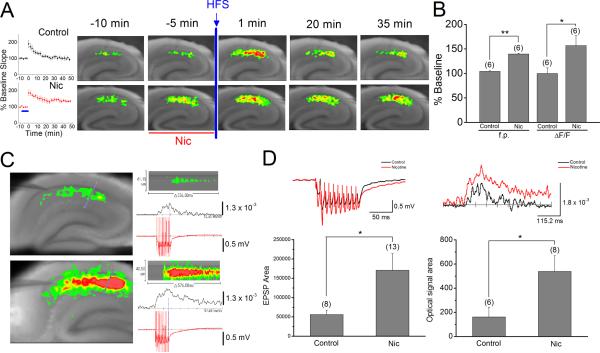
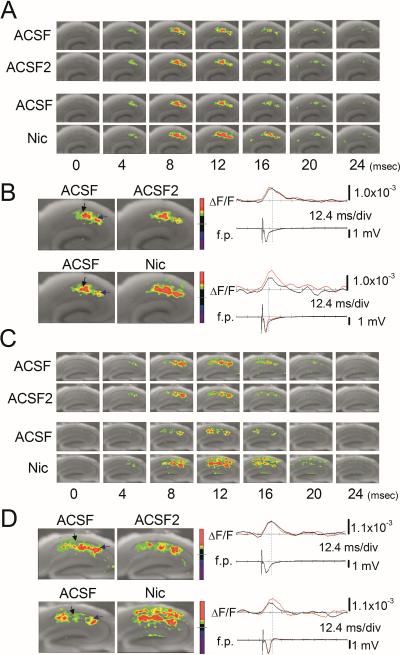
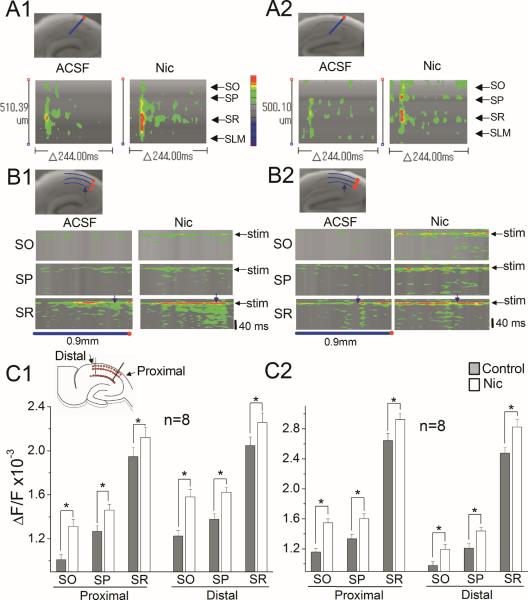
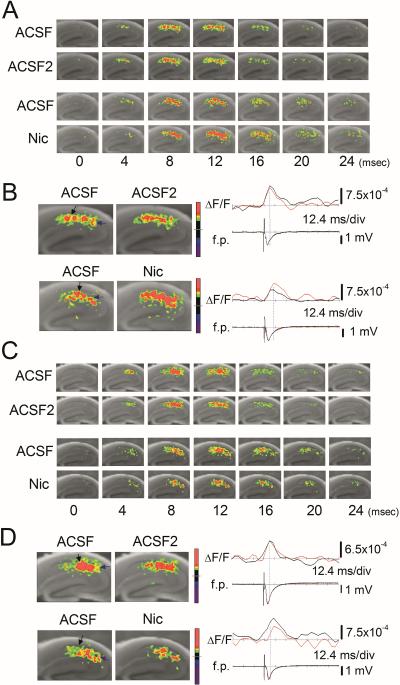
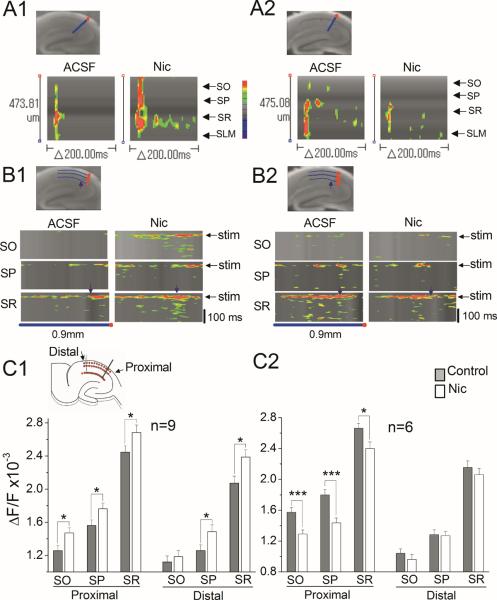
We examined the role of α7- and β2-containing nicotinic acetylcholine receptors (nAChRs) in the induction of long-term potentiation (LTP). Theta-burst stimulation (TBS), mimicking the brain's naturally occurring theta rhythm, induced robust LTP in hippocampal slices from α7 and β2 knockout mice. This suggests TBS is capable of inducing LTP without activation of α7- or β2-containing nAChRs. However, when weak TBS was applied, the modulatory effects of nicotinic receptors on LTP induction became visible. We showed that during weak TBS, activation of α7 nAChRs occurs by the release of ACh, contributing to LTP induction. Additionally, bath-application of nicotine activated β2-containing nAChRs to promote LTP induction. Despite predicted nicotine-induced desensitization, synaptically mediated activation of α7 nAChRs still occurs in the presence of nicotine and contributed to LTP induction. Optical recording of single-stimulation-evoked excitatory activity with a voltage-sensitive dye revealed enhanced excitatory activity in the presence of nicotine. This effect of nicotine was robust during high-frequency stimulation, and was accompanied by enhanced burst excitatory postsynaptic potentials. Nicotine-induced enhancement of excitatory activity was observed in slices from α7 knockout mice, but was absent in β2 knockout mice. These results suggest that the nicotine-induced enhancement of excitatory activity is mediated by β2-containing nAChRs, and is related to the nicotine-induced facilitation of LTP induction. Thus, our study demonstrates that the activation of α7- and β2-containing nAChRs differentially facilitates LTP induction via endogenously released ACh and exogenous nicotine, respectively, in the hippocampal CA1 region of mice.


Figures

Fig. 1
Fig. 1
LTP induced by conventional TBS was normal in α7 knockout and β2 knockout mice (A) Scheme of recording setup showing the position of stimulating and recording electrodes. (B) Conventional LTP in littermate wild-type and α7 knockout (α7 KO) mice. (C) Conventional LTP in littermate wild-type and β2 knockout (β2 KO) mice. (D) LTP induced in the presence of PNU 120596 (PNU) in wild-type mice. (B, C, and D) Changes in the slope of fEPSPs are plotted as the percentage change from initial baseline responses. Each trace above the graph in B, C, and D, and the following figures, was recorded at the time indicated. In this figure and the following figures, LTP-inducing stimulation was delivered at the time indicated by the arrow. Numbers in parentheses in this figure and the following figures indicate the numbers of experiments. Scale bars; 1 mV and 10 msec.
Fig. 2
Fig. 2
Endogenously released ACh and exogenous nicotine differentially facilitated LTP induction (A) In the absence of nicotine, weak TBS induced very small potentiation, which was blocked by the α7 nAChR antagonist MLA, but not β2-containing nAChR antagonist DHβE. The positive α7 nAChR allosteric modulator PNU 120596 enhanced LTP. (B) In the presence of nicotine, weak TBS induced large LTP, which was completely blocked by DHβE. MLA reduced LTP, while PNU 120596 increased LTP. (A), (B) Changes in the slope of fEPSPs were plotted as the percent change from initial baseline responses. Administration of nicotine in this figure and the following figure is indicated by the horizontal bar. Histograms show the percent change (mean ± SEM) in the slope of fEPSPs measured 40–50 min after delivery of weak TBS. Scale bars; 1 mV and 10 msec. *** P <0.001
Fig. 3
Fig. 3
Nicotine-induced facilitation of LTP induction was present in α7 knockout mice, but absent in β2 knockout mice A weak TBS was delivered in the absence and presence of nicotine in (A) littermate wild-type and α7 knockout mice (α7 KO), and in (B) littermate wild-type and β2 knockout mice (β2 KO). (A) A weak TBS induced LTP in the presence of nicotine in wild-type and α7 KO mice. (B, top) A weak TBS induced LTP in the presence of nicotine in wild-type, but not β2 KO mice. (A and B, top) Histograms show the percentage change (mean ± SEM) in the slope of fEPSPs measured 40–50 min after delivery of weak TBS. (B, bottom) The lack of β2* nAChRs has no significant effects on synaptic transmission and short-term synaptic plasticity. Input-output relationships of fEPSPs in wild-type and β2 KO mice (left). Initial slopes of fEPSPs as a function of presynaptic fiber volley amplitudes in wild-type and β2 KO mice (middle). Paired-pulse ratio of fEPSPs in wild-type and β2 KO mice (right). The ratio of the second fEPSP slope to the first fEPSP slope was calculated and is shown at interpulse intervals ranging from 25 to 200 msec. Representative traces for 50 msec interpulse interval are shown. There were no significant differences in all measures between wild-type and β2 KO mice. Scale bars; 1 mV and 10 msec. **P < 0.01, ***P <0.001
Fig. 4
Fig. 4
Nicotine enhanced optical signal and EPSPs during weak high frequency stimulation (A) Field EPSPs (left) and optical signal (right) were simultaneously recorded in the absence (Control, top) and presence of nicotine (Nic, bottom) during a LTP induction protocol. Pseudocolor representations of the voltage changes show in the response to a single stimulation in the absence (right, top) and presence of 1 μM nicotine (right, bottom) at different time points. (B) Histograms show the percent change (mean ± SEM) in the slope of fEPSPs and the amplitude of optical signals measured 35 min after delivery of high frequency stimulation. (C) Optical signal and EPSPs were simultaneously recorded during weak high frequency stimulation in the absence and presence of nicotine. Stimulation intensity was adjusted so that a single stimulation evoked similar sizes of fEPSPs in different slices. Pseudocolor representations of the voltage changes show in the response to weak high frequency stimulation in the absence (left, top) and presence of 1 μM nicotine (left, bottom). Pseudocolor representations of the line scanning across various anatomical layers, indicated in blue with a red dot (in left panels), over time in the absence (right, top) and presence (right, bottom) of nicotine. Comparisons of burst EPSPs and optical signal (ΔF/F) obtained in control (top traces) and nicotine (bottom traces) conditions are also shown. (D) Waveform comparison of burst EPSPs (left) and optical signals (right) evoked in the absence (black line) and presence (red line) of nicotine. Histograms show EPSP and optical signal areas recorded in the absence (Control) and presence of nicotine (Nic). *P < 0.05, **P < 0.01
Fig. 5
Fig. 5
Nicotine promoted excitatory neural activity in wild-type and α7 knockout mice (A–D) Pseudocolor representations of the voltage changes in response to a single stimulus in (A and B) wild-type and (C and D) α7 knockout (KO) mice. (A, C) Time series of optical signal recordings. (A and C, upper two panels) Comparison between the first (ACSF) and the second (ACSF2) optical signal recording. (A and C, lower two panels) Comparison between the first optical signal recording (ACSF) and the second optical signal recording in the presence of nicotine (Nic). (B and D) The maximum magnitude patterns of optical responses obtained in the first (ACSF, left panels) and the second (ACSF2 or Nic, right panels) recordings in control (upper panels) and nicotine (lower panels) conditions. The positions of stimulation (blue arrow) and recording (black arrow) electrodes in each experimental condition are indicated (B and D, left panels). (B and D, right traces) Comparisons of fEPSP (f.p.) and optical recording (ΔF/F) obtained in control (black line) and nicotine (red line) conditions in (B) wild-type and (D) α7 KO mice.
Fig. 6
Fig. 6
Nicotine promoted the spread of excitatory activity in both wild-type and α7 knockout mice (A1–C2) Nicotine increased the excitatory neural activity spatiotemporally in wild-type and α7 KO mice. (A1 and A2) Pseudocolor representations of the line scanning across various anatomical layers (blue with a red dot, top left in A1 and A2) over time in the absence (ACSF) and presence (Nic) of nicotine in (A1) wild-type and (A2) α7 KO mice. The scanning started 52 ms before stimulation and the fast depolarization peaked at 8 ms after stimulation. (B1 and B2) Pseudocolor representation of the line scanning along each anatomical layer over time in the absence (ACSF) and presence (Nic) of nicotine in (B1) wild-type and (B2) α7 KO mice. The curved line (blue with a red dot, 0.9 mm in length) was set along each layer. The blue arrow shows the place of stimulating electrode, and the black arrow indicates the time point of stimulation delivery. The blue line with a red dot under the image corresponds to that set along each layer (top left in B1 and B2). (C1 and C2) For comparisons across slices, the maximum optical responses were sampled with a 3 × 21 sampling grid (top left), anchored to the proximal site of the stimulating electrode and covering various anatomical layers. Average responses in the absence (control) and presence of nicotine (Nic) along various anatomical layers in (C1) wild-type and (C2) α7 KO mice were plotted. Data are means ± SEM. *P < 0.05
Fig. 7
Fig. 7
Nicotine decreased the excitatory neural activity in β2 knockout mice (A–D) Pseudocolor representations of the voltage changes in response to a single stimulus in (A and B) wild-type and (C and D) β2 knockout (KO) mice. Each recording was obtained and presented as in Fig. 5. (A, C) Time series of optical signal recordings. (B and D) The maximum magnitude patterns of optical responses. (B and D, right traces) Comparisons of fEPSP (f.p.) and optical recording (ΔF/F) obtained in control and nicotine conditions in (B) wild-type and (D) β2 KO mice as in Fig. 5.
Fig. 8
Fig. 8
Nicotine suppressed the spread of excitatory activity in β2 knockout mice (A1–C2) Nicotine suppressed the excitatory neural activity in β2 KO mice. (A1 and A2) Pseudocolor representations of the line scanning across various anatomical layers over time in the absence (ACSF) and presence of nicotine (Nic) in (A1) wild-type and (A2) β2 KOmice. (B1 and B2) Pseudocolor representation of the line scanning along each anatomical layer over time in the absence (ACSF) and presence of nicotine (Nic) in (B1) wild-type and (B2) β2 KO mice. Experiments were carried out as in Fig. 6. (C1 and C2) For comparisons across slices, the maximum optical responses were sampled as in Fig. 6. Average responses in the absence (control) and presence of nicotine (Nic) along various anatomical layers in (C1) wild-type and (C2) β2 KO mice were plotted. Data are means ± SEM. *P < 0.05, *** P < 0.001.
Fig. 9
Fig. 9
Nicotine depressed evoked IPSCs recorded in CA1 pyramidal cells via activation of β2-containing nAChRs Voltage-clamped cells (at −60 mV) were stimulated at 300 μA, at which nicotine causes a clear effect, in the stratum radiatum in the presence of 6,7-Dinitroquinoxaline-2,3-dione (20 μM) and DL-(−)-2-Amino-5-phosphonopentanoic acid (50 μM). A stimulating electrode was placed in the stratum radiatum within 500 μm of recorded pyramidal cells. (A) Sample traces triggered in the absence (control) and presence of nicotinic drugs. Each trace was an average of three sequential responses. (B) Histograms show the effects of different nicotinic drugs on IPSCs, expressed as a percentage of control amplitude. Numbers in parentheses in this and the following figures indicate the numbers of experiments. *P < 0.05. Scale bars: 50 ms and 100 pA.

Similar articles

Cited by

References

    1. Alkondon M, Albuquerque EX. Nicotinic acetylcholine receptor alpha7 and alpha4beta2 subtypes differentially control GABAergic input to CA1 neurons in rat hippocampus. J Neurophysiol. 2001;86:3043–3055. - PubMed
    1. Alkondon M, Pereira EF, Albuquerque EX. alpha-bungarotoxin- and methyllycaconitine-sensitive nicotinic receptors mediate fast synaptic transmission in interneurons of rat hippocampal slices. Brain Res. 1998;810:257–263. - PubMed
    1. Alkondon M, Pereira EF, Almeida LE, Randall WR, Albuquerque EX. Nicotine at concentrations found in cigarette smokers activates and desensitizes nicotinic acetylcholine receptors in CA1 interneurons of rat hippocampus. Neuropharmacology. 2000;39:2726–2739. - PubMed
    1. Alkondon M, Pereira EF, Barbosa CT, Albuquerque EX. Neuronal nicotinic acetylcholine receptor activation modulates gamma-aminobutyric acid release from CA1 neurons of rat hippocampal slices. J Pharmacol Exp Ther. 1997;283:1396–1411. - PubMed
    1. Bliss TV, Collingridge GL. A synaptic model of memory: long-term potentiation in the hippocampus. Nature. 1993;361:31–39. - PubMed

Publication types

MeSH terms