. 2012 Mar;22(1):013119.
doi: 10.1063/1.3683444.

Finger tapping movements of Parkinson's disease patients automatically rated using nonlinear delay differential equations

Affiliations

Finger tapping movements of Parkinson's disease patients automatically rated using nonlinear delay differential equations

C Lainscsek et al. Chaos. 2012 Mar.

Abstract

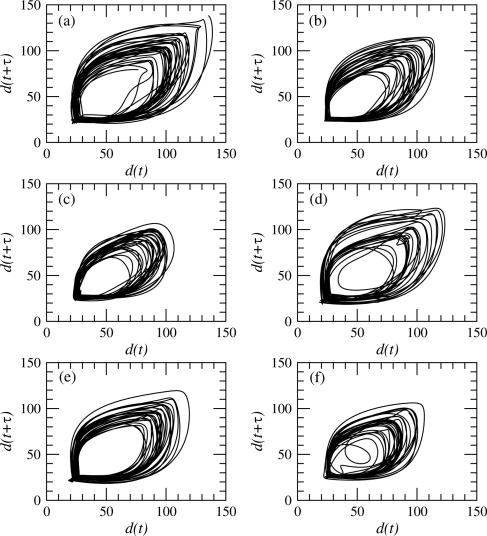
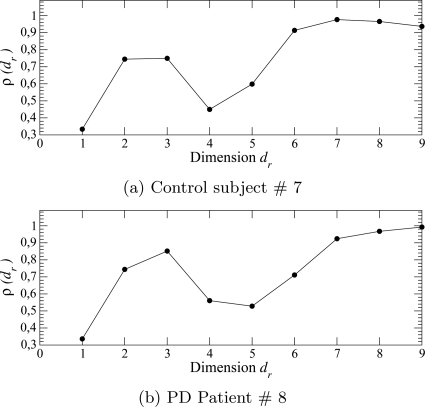
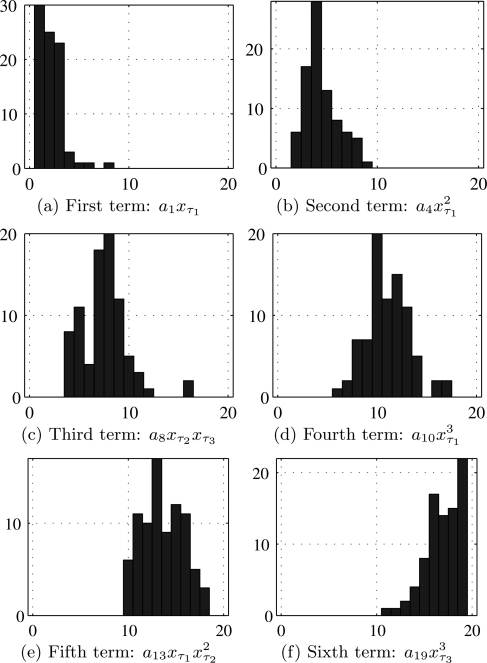
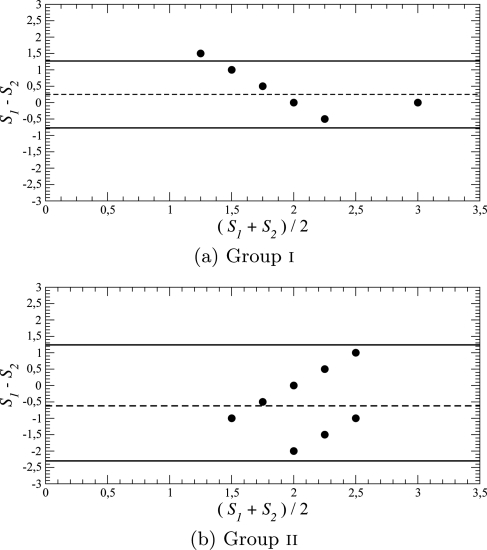
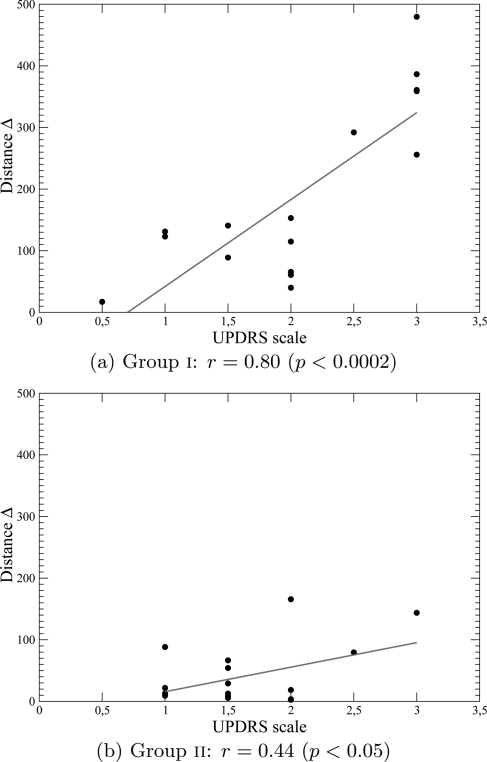
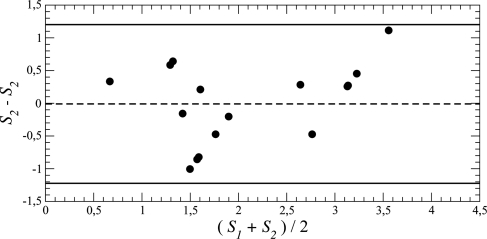
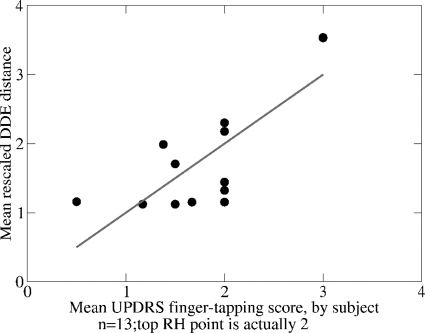
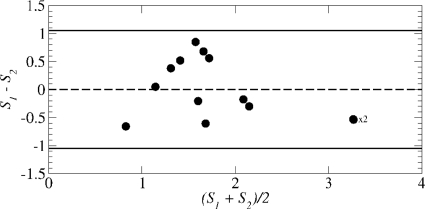
Parkinson's disease is a degenerative condition whose severity is assessed by clinical observations of motor behaviors. These are performed by a neurological specialist through subjective ratings of a variety of movements including 10-s bouts of repetitive finger-tapping movements. We present here an algorithmic rating of these movements which may be beneficial for uniformly assessing the progression of the disease. Finger-tapping movements were digitally recorded from Parkinson's patients and controls, obtaining one time series for every 10 s bout. A nonlinear delay differential equation, whose structure was selected using a genetic algorithm, was fitted to each time series and its coefficients were used as a six-dimensional numerical descriptor. The algorithm was applied to time-series from two different groups of Parkinson's patients and controls. The algorithmic scores compared favorably with the unified Parkinson's disease rating scale scores, at least when the latter adequately matched with ratings from the Hoehn and Yahr scale. Moreover, when the two sets of mean scores for all patients are compared, there is a strong (r = 0.785) and significant (p<0.0015) correlation between them.


Figures

Figure 1
Figure 1
(Color online) Distance between thumb and index finger markers are plotted over time. Example of a time series with 7% occlusions in the recorded data (a). The dots denote the occluded points. The upsampled data (b) have an occlusion rate of 16%. In (c) after removing all effective occlusions, 70% of the original data is usable.
Figure 2
Figure 2
Time series of the distance between the thumb and the index finger during the individual finger tapping for a control subject (a) and a PD patient (b) from group ii. The sampling rate equals to 480 Hz. Note, that the PD patient has much reduced movement amplitude. However, there was substantial overlap in movement amplitude between the control subjects and PD patients and amplitude alone was not sufficient to discriminate the groups.
Figure 3
Figure 3
(Color online) Amplitude versus time for individual finger tapping by control subjects—(a) and (b)—and by PD patients—(c) and (d)—from group ii. The six 10 s sessions are concatenated to exhibit the tendency. Linear regression is shown as a red line. A· is the slope of the regression line and A¯ is the mean amplitude.
Figure 4
Figure 4
Phase portrait reconstructed from the distance between the index finger and the thumb using the delay coordinates. Case of control subject no. 13 (group ii).
Figure 5
Figure 5
Phase portrait reconstructed from the distance between the index finger and the thumb using the delay coordinates. Case of PD patient no. 8 from group ii.
Figure 6
Figure 6
Estimating the embedding dimension using a false nearest neighbors technique. Case of a control subject (a) and a PD patient from group ii. The fourth finger tapping session was here used.
Figure 7
Figure 7
(Color online) Histograms for the retained monomials in the 19-term DDE (3) for the 84 runs of the structure selection algorithm on group ii data sets. The x-axis is the index of monomials as in Eq. 3.
Figure 8
Figure 8
(Color online) Histograms of the delays for the 42 data files of the controls. The numbers on the x-axis are the delays and the numbers on the y-axis are the number of occurrences. The dominant three peaks are τ=(0,29,41).
Figure 9
Figure 9
Comparing the UPDRS finger-tapping ratings and HY ratings for Parkinson’s disease. Difference plotted versus mean, where S1=SUPDRS and S2=SHY. The solid horizontal lines indicate the 95% confidence limits. The dashed lines indicate the mean difference: positive for group i and negative for group ii.
Figure 10
Figure 10
(Color online) Comparing the UPDRS and DDE ratings for Parkinson’s disease finger-tapping.
Figure 11
Figure 11
Comparing the UPDRS and DDE ratings for Parkinson’s disease finger-tapping: Difference versus mean. S1=SUPDRS and S2=S˜. Data sets from group i.
Figure 12
Figure 12
(Color online) Comparing the mean rescaled DDE and mean UPDRS, finger-tapping ratings for all subjects from groups i and ii combined: r=0.785(p<0.0015).
Figure 13
Figure 13
Comparing the mean rescaled DDE and mean UPDRS finger-tapping ratings for all subjects together: Difference versus mean. S1=S˜G and S2=SUPDRS¯. 95% confidence limit = 1.05.

References

    1. Rodriguez-Oroz M. C., Jahanshahi M., Krack P., Litvan I., Macias R., Bezard E., and Obeso J. A., Lancet Neurol. 8(12 ), 1128 (2009).10.1016/S1474-4422(09)70293-5 - DOI - PubMed
    1. Rivlin-Etzion M., Marmo O., Heimer G., Raz A., Nini A., and Bergman H., Curr. Opin. Neurobiol. 16, 629 (2006).10.1016/j.conb.2006.10.002 - DOI - PubMed
    1. Brown R. G. and Marsden C. D., Trends Neurosci. 13(1 ), 21 (1990).10.1016/0166-2236(90)90058-I - DOI - PubMed
    1. Benecke R., Rothwell J. C., Dick J. P. R., Day B. L., and Marsden C. D., Brain 110(2 ), 361 (1987).10.1093/brain/110.2.361 - DOI - PubMed
    1. Flowers K. A., Brain 99(2 ), 269 (1976).10.1093/brain/99.2.269 - DOI - PubMed

Publication types