. 2012 May 25;36(5):847-56.
doi: 10.1016/j.immuni.2012.02.012. Epub 2012 Mar 29.

Interleukin-2 inhibits germinal center formation by limiting T follicular helper cell differentiation

Affiliations

Interleukin-2 inhibits germinal center formation by limiting T follicular helper cell differentiation

André Ballesteros-Tato et al. Immunity. .

Abstract

T follicular helper (Tfh) cells promote T cell-dependent humoral immune responses by providing T cell help to B cells and by promoting germinal center (GC) formation and long-lived antibody responses. However, the cellular and molecular mechanisms that control Tfh cell differentiation in vivo are incompletely understood. Here we show that interleukin-2 (IL-2) administration impaired influenza-specific GCs, long-lived IgG responses, and Tfh cells. IL-2 did not directly inhibit GC formation, but instead suppressed the differentiation of Tfh cells, thereby hindering the maintenance of influenza-specific GC B cells. Our data demonstrate that IL-2 is a critical factor that regulates successful Tfh and B cell responses in vivo and regulates Tfh cell development.


Figures

Figure 1
Figure 1. IL-2 inhibits B cell responses to influenza
B6 mice were infected with PR8 and treated with 30,000 U of human rIL-2 or PBS daily starting 3 days after infection. (A) Serum was obtained on day 21 after infection and titers of influenza-specific IgG1 were determined by ELISA. (B) Influenza-specific IgG-secreting cells in the BM were enumerated by ELISPOT on day 21 after infection. Data are representative of two independent experiments (mean ± s.d of 5 mice per group).
Figure 2
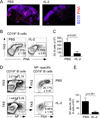
Figure 2. IL-2 impairs GC B cell responses to influenza
(A) B6 mice were infected with PR8 and treated with 30,000 U of human recombinant rIL-2 or PBS twice a day starting 3 days after infection. mLNs were obtained on day 10 after infection and cryosections were stained with anti-B220 (blue) and PNA (red) and analyzed by fluorescent microscopy. (B–C) Cells from the mLNs of mice treated with IL-2 or PBS were obtained on day 10 and the percentage of CD19+ B cells with a PNA+FAS+ GC phenotype was determined (B), and the number of GC B cells was calculated (C). Data are representative of four independent experiments (mean ± s.d of 5 mice per group). (D–E) Cells from mLN were obtained on day 10 after infection and GC B cells were identified by flow cytometry using an NP-tetramer. The percentage of NP-specific B cells with a PNA+FAS+ GC phenotype was determined (D) and the number of NP-specific PNA+FAS+ CD19+ B cells was calculated (E). Data are representative of three independent experiments (mean ± s.d of 5 mice per group). All P values were determined using a two-tailed Student´s t-test. See also Supp. Fig. 1.
Figure 3
Figure 3. rIL-2 indirectly inhibits GC B cell response to influenza
(A–H) B6 mice were irradiated and reconstituted with a 50:50 mix of BM from wild type CD45.1 donors and Cd25−/− donors (CD45.2) and the percentage of leukocytes that expressed either CD45.1 or CD45.2 was determined in the mLN 8 weeks after reconstitution (A). (B–D) Reconstituted mice were infected with PR8, treated daily with 30,000 U of PBS (B) or rIL-2 (C) starting 3 days after infection and the percentage of CD45.1+ or CD45.2+ CD19+ B cells with a PNA+FAS+ GC phenotype cells was determined on day 10. (D) The ratio of B6 to Cd25−/− PNA+FAS+ CD19+ B cells was calculated. (E–G) Reconstituted mice were infected with PR8, treated daily with 30,000 U of rIL-2 or PBS starting 3 days after infection and on day 10 the percentage of CD45.1+ or CD45.2+ NP-specific CD19+ B cells with a PNA+FAS+ GC phenotype was determined in the mLN of mice treated with PBS (E) or with rIL-2 (F). (G) The ratio of B6 to Cd25−/− PNA+FAS+ NP-specific CD19+ B cells was determined. Data are representative of three independent experiments (mean ± s.d of 3–5 mice five mice per group). P values were determined using a two-tailed Student´s t-test.
Figure 4
Figure 4. Inhibition of the GC B cells response after rIL-2 treatment do not required FoxP3+ Tregs
(A) FoxP3-DTR mice were infected with PR8, administered PBS, or DT on days 0, 4 and 7 after infection, or received DT on days 0, 4 and 7 after infection together with 30,000 U of human recombinant rIL-2 twice a day starting 3 days after infection. Cells from the mLN were analyzed on day 10. The percentage of CD4+ T cells that expressed FoxP3 (A), and the percentage of CD19+ B cells with a FAS+PNA+ GC phenotype (B) were determined by flow cytometry. (C) The number of FAS+PNA+ GC B cells was calculated. Data are representative of two independent experiments (mean ± s.d of 5 mice per time point). P values were determined using a two-tailed Student´s t-test.
Figure 5
Figure 5. rIL-2 impairs the Tfh cell response to influenza
(A) B6 mice were infected with PR8 and the expression of Bcl6 and ICOS was evaluated on PD-1hiCXCR5hiCD4+ T cells and PD-1loCXCR5loCD4+ T cells on day 10. (B–D) B6 mice were infected with PR8, treated with 30,000 U of human rIL-2 or PBS twice a day starting 3 days after infection and cells from the mLNs were analyzed by flow cytometry on day 10. (B) The expression of Bcl6 in CD4+ T cells was evaluated. (C) The percentage of CD4+ T cells with a CXCR5hiPD-1hi Tfh phenotype was determined. (D) The number of CXCR5hiPD-1hi Tfh cells was calculated. (E–F) B6 mice were infected with PR8, treated with 30,000 U of human rIL-2 or PBS twice a day starting 3 days after infection and cells from the mLNs were analyzed by flow cytometry on day 6. (E) The percentage of CD4+ T cells with a CXCR5hiPD-1hi Tfh phenotype was determined. (F) The number of CXCR5hiPD-1hi Tfh cells was calculated. (G) Bcl6, ICOS and CD25 expression was evaluated on PD-1hiCXCR5hi NP-specific CD4+ T cells and PD-1loCXCR5lo NP-specific CD4+ T cells. (H) The expression of Bcl6 in NP-specific CD4+ T cells was evaluated. (I) The percentage of NP-specific CD4+ T cells with a CXCR5hiPD-1hi Tfh phenotype was determined. (J) The number of NP-specific CXCR5hiPD-1hi Tfh cells was calculated. (K) The number of NP-specific CXCR5loPD-1lo effector CD4+ T cells was calculated. (L) The expression of Bcl6 on CD4+CXCR5+PD-1hi cells and NP-specific CD4+CXCR5+PD-1hi cells from IL-2-treated and control mice was evaluated by flow cytometry. Data are representative of four independent experiments (mean ± s.d of 5 mice per group). P values were determined using a two-tailed Student´s t-test.
Figure 6
Figure 6. IL-2 signaling directly inhibits Tfh responses to influenza
(A–B) B6 mice were irradiated and reconstituted with a 50:50 mix of BM from wild type CD45.1 donors and Cd25−/− donors (CD45.2). Reconstituted mice were infected with PR8, treated daily with 30,000 U of rIL-2 starting 3 days after infection and cells from the mLN were analyzed on day 10. The percentage of CD45.1+ or CD45.2+ CD4+CXCR5+PD-1hi Tfh cells (A) and NP-specific CD45.1+ or CD45.2+ CD4+CXCR5+PD-1hi Tfh cells (B) was determined. Data were pooled from three independent experiments (mean ± s.d ). Representative plots gated on CD4+ T cells are shown. (C–D) B6 mice were irradiated and reconstituted with a 50:50 mix of BM from wild type CD45.1 donors and Cd25−/− donors (CD45.2). Reconstituted mice were infected with PR8, and cells from the mLN were analyzed on day 10. The percentage of CD45.1+ or CD45.2+ CD4+CXCR5+PD-1hi Tfh cells (C) and NP-specific CD45.1+ or CD45.2+ CD4+CXCR5+PD-1hi Tfh cells (D) was determined. (E) The percentage of CD45.1+ or CD45.2+ total CD4+ T cells was determined. Plot is gated on CD4+ T cells. Data were pooled from three independent experiments (mean ± s.d ). Representative plots gated on CD4+ T cells are shown. P values were determined using a two-tailed Student´s t-test.

Comment in

References

    1. Alexander CM, Tygrett LT, Boyden AW, Wolniak KL, Legge KL, Waldschmidt TJ. T regulatory cells participate in the control of germinal centre reactions. Immunology. 2011;133:452–468. - PMC - PubMed
    1. Allen CD, Okada T, Cyster JG. Germinal-center organization and cellular dynamics. Immunity. 2007;27:190–202. - PMC - PubMed
    1. Almeida AR, Legrand N, Papiernik M, Freitas AA. Homeostasis of peripheral CD4+ T cells: IL-2R alpha and IL-2 shape a population of regulatory cells that controls CD4+ T cell numbers. J Immunol. 2002;169:4850–4860. - PubMed
    1. Bachmann MF, Schorle H, Kuhn R, Muller W, Hengartner H, Zinkernagel RM, Horak I. Antiviral immune responses in mice deficient for both interleukin-2 and interleukin-4. J Virol. 1995;69:4842–4846. - PMC - PubMed
    1. Beckett D, Kovaleva E, Schatz PJ. A minimal peptide substrate in biotin holoenzyme synthetase-catalyzed biotinylation. Protein science : a publication of the Protein Society. 1999;8:921–929. - PMC - PubMed

Publication types

MeSH terms