. 2012 Apr 4;15(4):554-62.
doi: 10.1016/j.cmet.2012.02.012. Epub 2012 Mar 29.

The Bcl6-SMRT/NCoR cistrome represses inflammation to attenuate atherosclerosis

Affiliations

The Bcl6-SMRT/NCoR cistrome represses inflammation to attenuate atherosclerosis

Grant D Barish et al. Cell Metab. .

Abstract

Chronic inflammation is a hallmark of atherosclerosis, but its transcriptional underpinnings are poorly understood. We show that the transcriptional repressor Bcl6 is an anti-inflammatory regulator whose loss in bone marrow of Ldlr(-/-) mice results in severe atherosclerosis and xanthomatous tendonitis, a virtually pathognomonic complication in patients with familial hypercholesterolemia. Disruption of the interaction between Bcl6 and SMRT or NCoR with a peptide inhibitor in vitro recapitulated atherogenic gene changes in mice transplanted with Bcl6-deficient bone marrow, pointing to these cofactors as key mediators of Bcl6 inflammatory suppression. Using ChIP-seq, we reveal the SMRT and NCoR corepressor cistromes, each consisting of over 30,000 binding sites with a nearly 50% overlap. While the complete cistromes identify a diversity of signaling pathways, the Bcl6-bound subcistromes for each corepressor are highly enriched for NF-κB-driven inflammatory and tissue remodeling genes. These results reveal that Bcl6-SMRT/NCoR complexes constrain immune responses and contribute to the prevention of atherosclerosis.


Figures

Figure 1
Figure 1
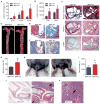
Bcl6 represses atherogenesis and xanthomatous tendonitis. (A, B) Quantification of en face aorta and aortic root lesions in BMT mice exposed to atherogenic diet. (C) Aortic valve sections from BMT mice fed atherogenic diet for 8 weeks, showing (top) Masson trichrome staining (connective tissue is blue), (middle) MØ-specific Moma-2 antibody immunostaining (red), and (bottom) α-smooth muscle actin (SMA) antibody immunostaining (red). (D) Sudan IV-stained aortas of BMT mice (13 weeks). (E) Masson’s trichrome staining of aortic root atheromas (*). (F) Moma-2 immunohistochemical staining (red) with hematoxylin counterstain of aortic root atheromas. Open arrow marks necrotic core in BMT-KO atheroma. (G) Quantitation of necrotic cores from aortic root lesions in BMT mice after 16 weeks of atherogenic diet, expressed as % of total lesion area. (H) Hind limbs from BMT-WT and BMT-KO mice. Red arrows indicate lesions. (I) Quantification of distal hind limb volumes (n = 10 for BMT-WT, n = 7 for BMT-KO). (J) Representative sagittal sections comparing BMT-WT and BMT-KO hind limbs, H & E staining. Section of BMT-KO mouse shows obliteration of the subcutaneous and tendinous tissues with thick fibroblastic proliferation containing cholesterol clefts and mixed inflammatory infiltrate (solid arrows). (K) High power view of xanthoma in a BMT-KO mouse showing a collection of foam cell MØs (open arrow) surrounded by fibrosis and inflammatory cells (solid arrow) and effacement of normal subcutaneous and tendinous tissues (*), H & E staining. For AB, G, and I values are means ± SD. Statistical significance was determined using 2-tailed t-tests: +p < 0.05, #p < 0.01, *p < 0.001.
Figure 2
Figure 2
Bcl6 regulates pro-atherogenic genes in vitro and in vivo. (A) qPCR assessment of gene expression in WT, HET, and KO MØs ± exposure to mmLDL. (B) Expression analysis of flushed bone marrow from BMT-WT (n = 6) and BMT-KO (n = 7) mice after two weeks of atherogenic diet. (C) Gene expression in whole aortas from BMT-WT (n = 6) and BMT-KO (n= 7) mice after two weeks of atherogenic diet normalized to the F4/80 MØ marker gene. (D) Plasma protein levels of chemokines in BMT-WT and BMT-KO mice following 13 weeks of atherogenic diet (n = 9 for each cohort). (E) Representative immunostained aortic root sections from BMT-WT and BMT-KO detecting Ccl2, Il-1α, Plau, and F3 (red) in atherosclerotic lesions following 8 weeks of atherogenic diet. Boxes indicate representative lesions. For AD, values are expressed as means ± SD. Statistical testing to compare the genotypes for each treatment condition performed with (A) one-way ANOVA and Tukey’s multiple comparison tests or (BD) 2-tailed t-tests, +p < 0.05, #p < 0.01, *p < 0.001.
Figure 3
Figure 3
Bcl6 represses atherogenic genes using SMRT and NCoR. (A, B) Gene expression in wild type mouse (A) and human (B) MØs following 12-hour treatment with 5 μM of control (CP) or Bcl6 inhibitor peptide (RI-BPI). (C) Venn diagram comparing the SMRT and NCoR cistromes and their overlap in wild type mouse MØs. The numbers of unique and overlapping binding sites are listed. (D) Binding site motif predictions based on ChIP-seq of SMRT (left) and NCoR (right) in MØs. The p-values were determined by Fisher’s exact test. (E) Venn diagram comparing the Bcl6-SMRT versus Bcl6-NCoR sub-cistromes. The numbers of unique and overlapping binding sites are listed. (F) Motif analysis for the Bcl6-SMRT (top) and Bcl6-NCoR (bottom) cistromes. The p-values were determined by Fisher’s exact test. (G) Graph of the % co-localization between the NF-κB cistrome and the Bcl6 cistrome (all sites), SMRT cistrome (all sites), NCoR cistrome (all sites), Bcl6-SMRT sub-cistrome, or Bcl6-NCoR sub-cistrome. (H,I) ChIP-sequencing tracks for SMRT (blue), NCoR (red), and Bcl6 (black) in wild type and Bcl6 KO MØs along (H) Ccl2/Ccl7 gene cluster and (I) Plau. Co-localization of Bcl6, SMRT, and NCoR is observed at several sites in wild type MØs and is associated with loss of SMRT and NCoR peaks in KO cells. Exon positions are depicted horizontally in blue. Tag counts are indicated on the vertical axis. Tracks were normalized to 1E+07 reads.

References

    1. Adhikari N, Charles N, Lehmann U, Hall JL. Transcription factor and kinase-mediated signaling in atherosclerosis and vascular injury. Curr Atheroscler Rep. 2006;8:252–260. - PubMed
    1. Andrae J, Gallini R, Betsholtz C. Role of platelet-derived growth factors in physiology and medicine. Genes Dev. 2008;22:1276–1312. - PMC - PubMed
    1. Barish GD, Yu RT, Karunasiri M, Ocampo CB, Dixon J, Benner C, Dent AL, Tangirala RK, Evans RM. Bcl-6 and NF-kappaB cistromes mediate opposing regulation of the innate immune response. Genes Dev. 2010;24:2760–2765. - PMC - PubMed
    1. Basso K, Dalla-Favera R. BCL6: master regulator of the germinal center reaction and key oncogene in B cell lymphomagenesis. Adv Immunol. 105:193–210. - PubMed
    1. Cerchietti LC, Yang SN, Shaknovich R, Hatzi K, Polo JM, Chadburn A, Dowdy SF, Melnick A. A peptomimetic inhibitor of BCL6 with potent antilymphoma effects in vitro and in vivo. Blood. 2009;113:3397–3405. - PMC - PubMed

Publication types

MeSH terms

Associated data