. 2012 May 1;260(3):285-93.
doi: 10.1016/j.taap.2012.03.006. Epub 2012 Mar 18.

Relative contribution of CTR1 and DMT1 in copper transport by the blood-CSF barrier: implication in manganese-induced neurotoxicity

Affiliations

Relative contribution of CTR1 and DMT1 in copper transport by the blood-CSF barrier: implication in manganese-induced neurotoxicity

Gang Zheng et al. Toxicol Appl Pharmacol. .

Abstract

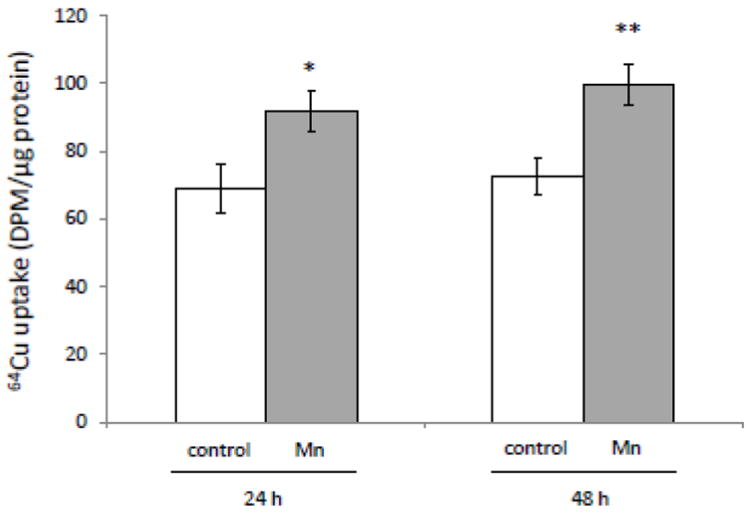
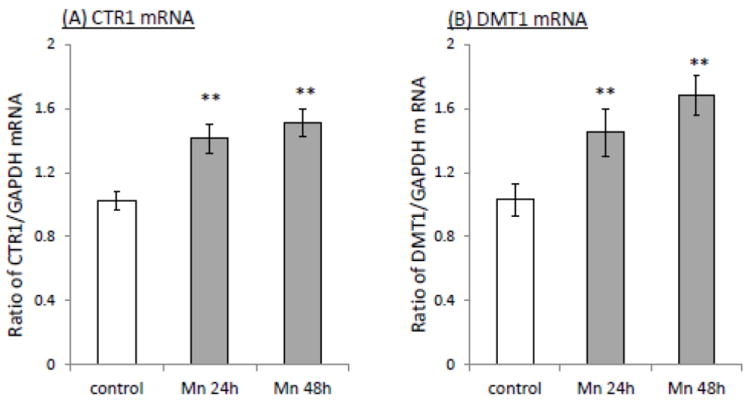
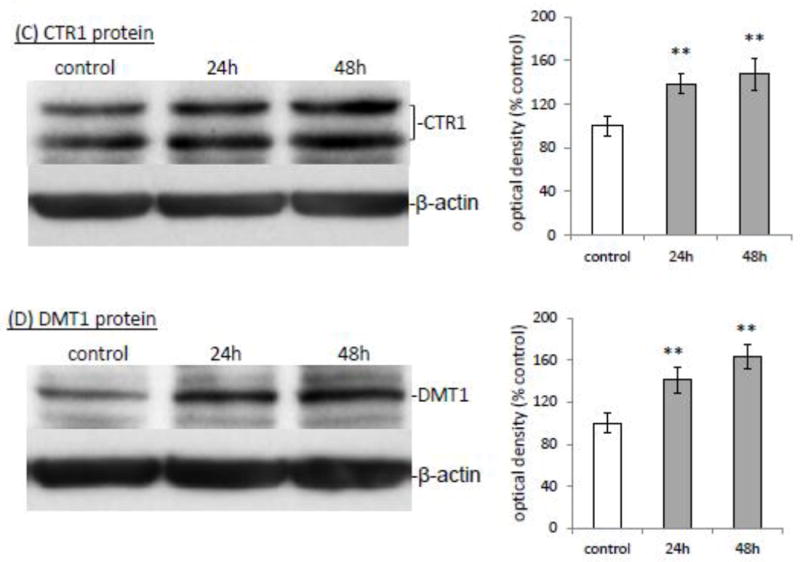
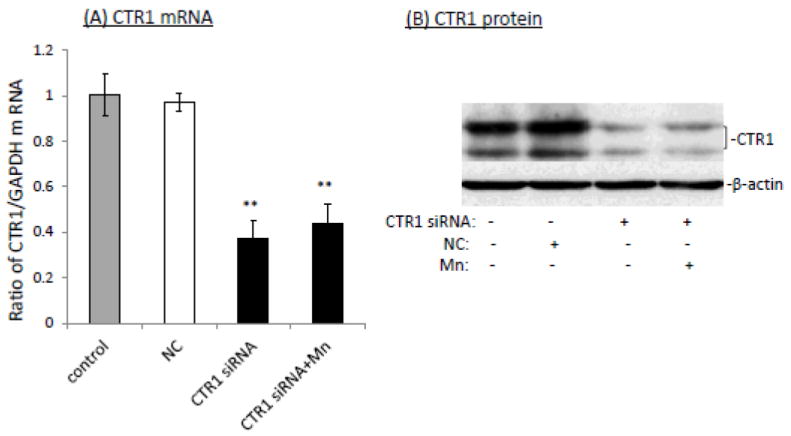
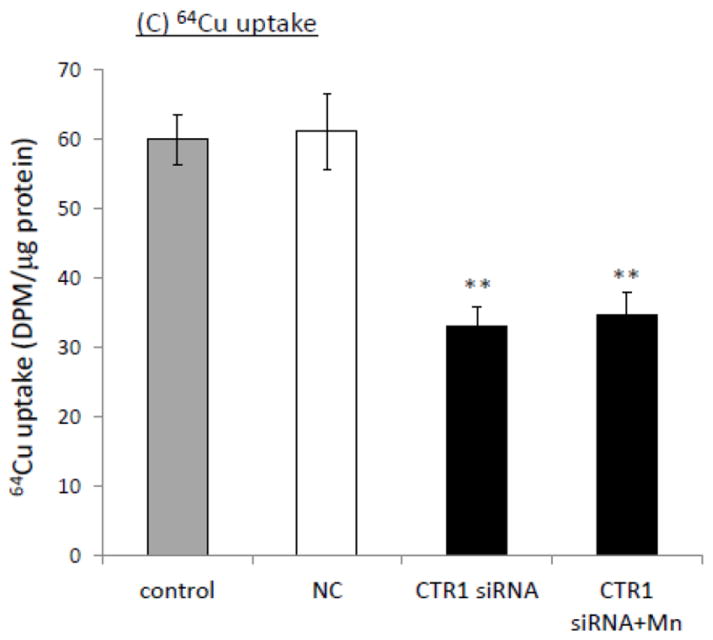
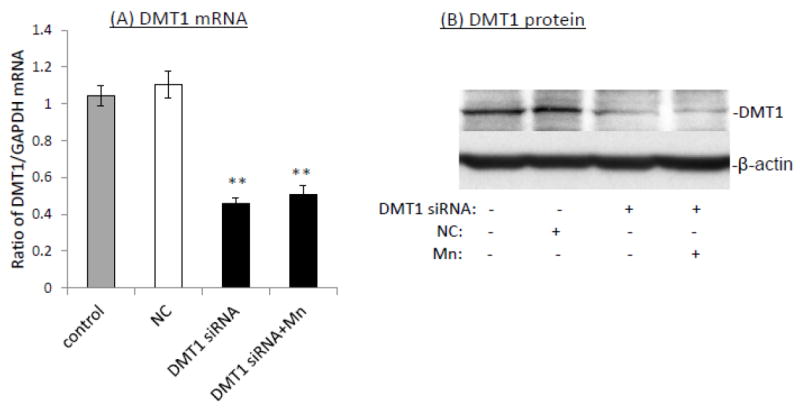
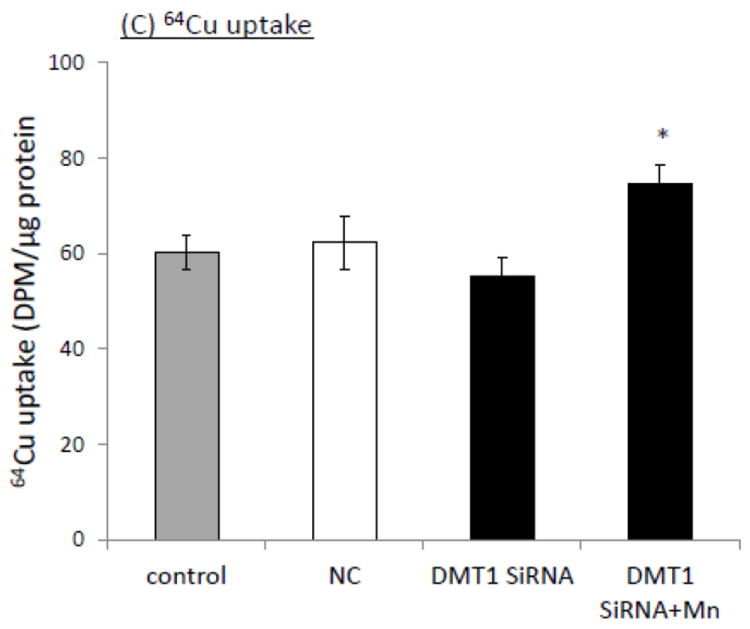
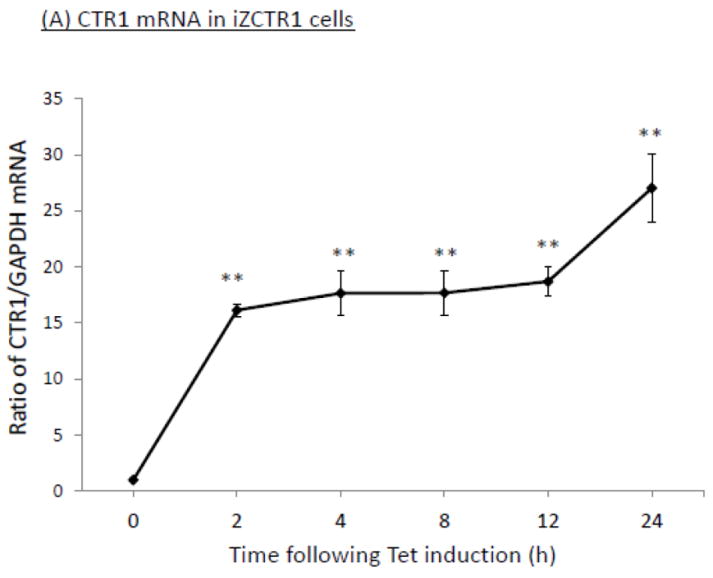
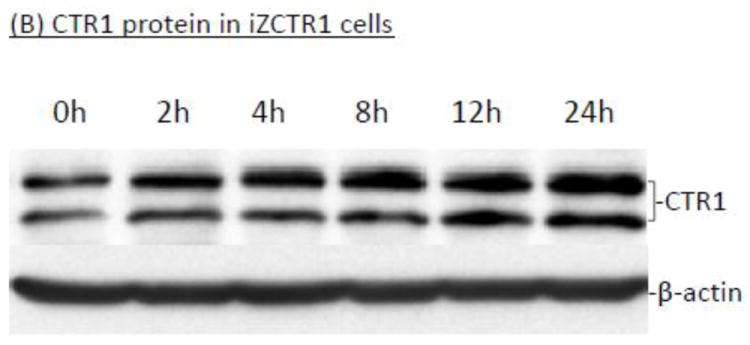
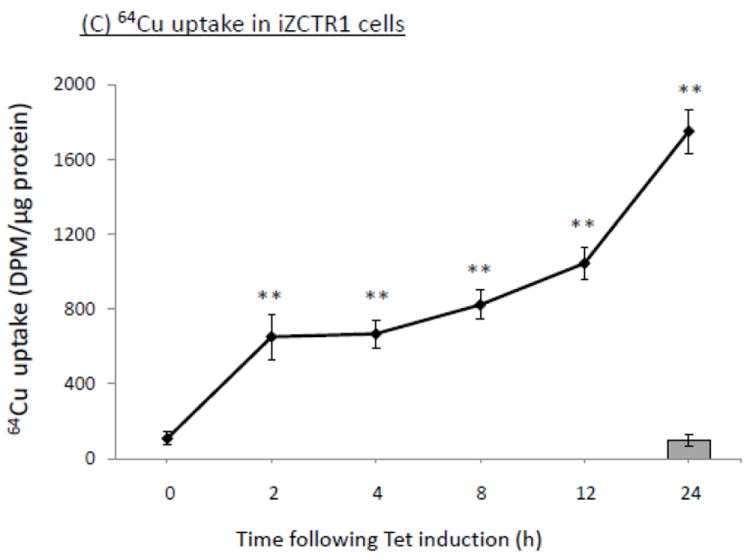
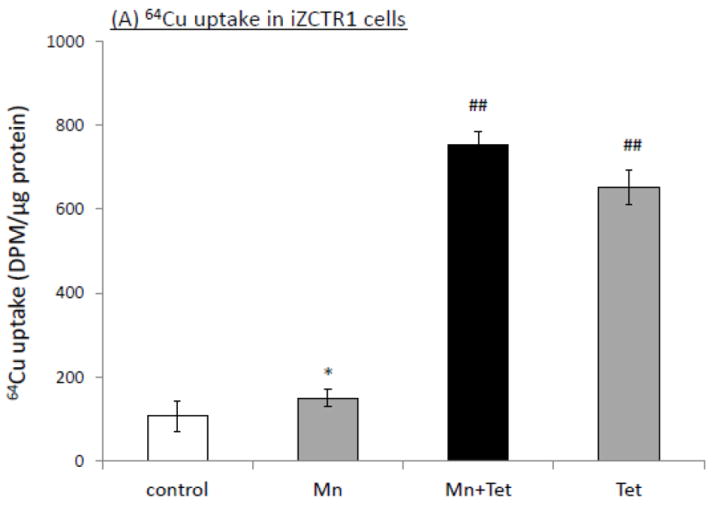
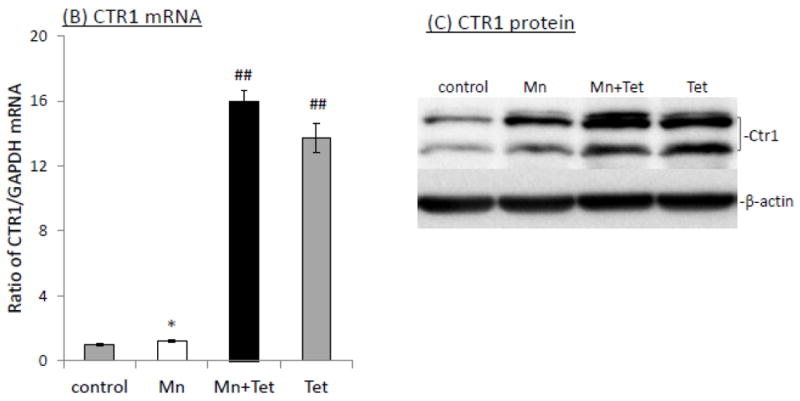
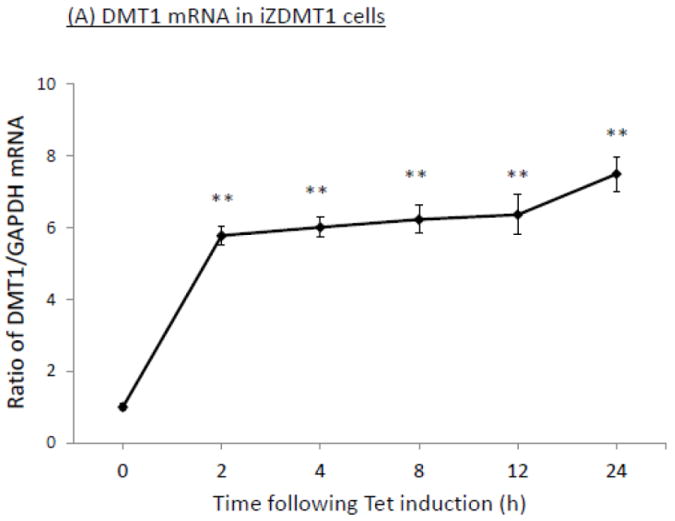
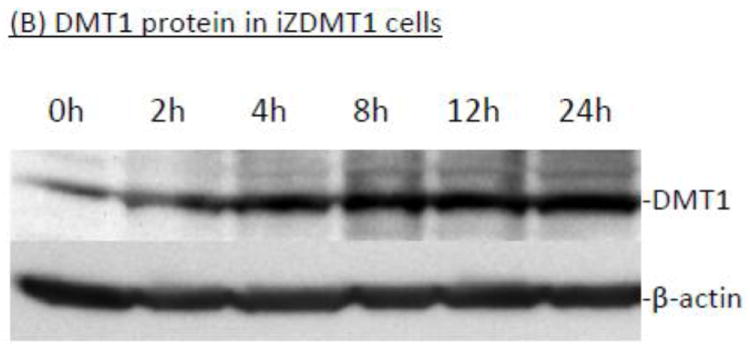
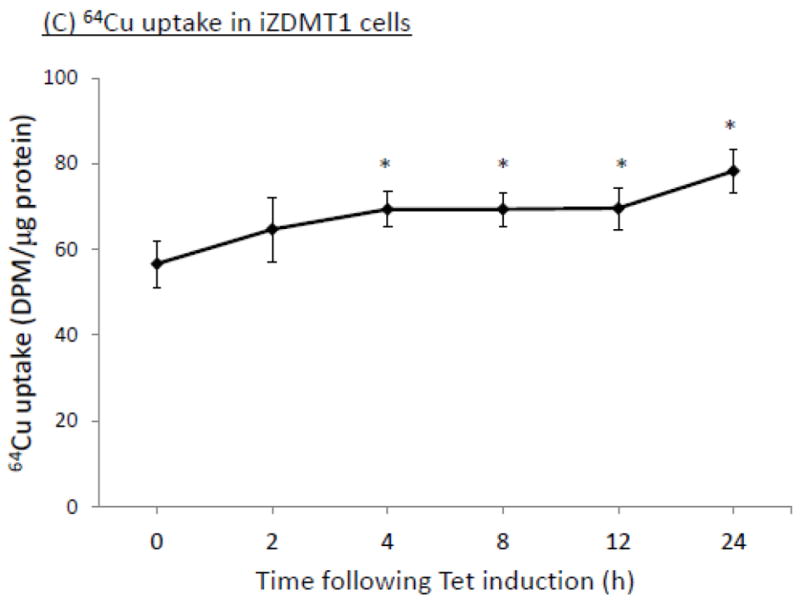
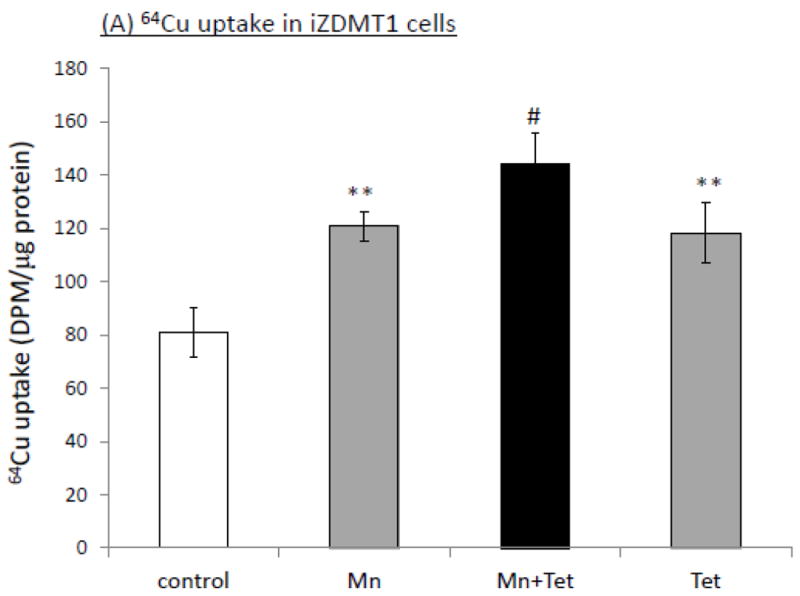
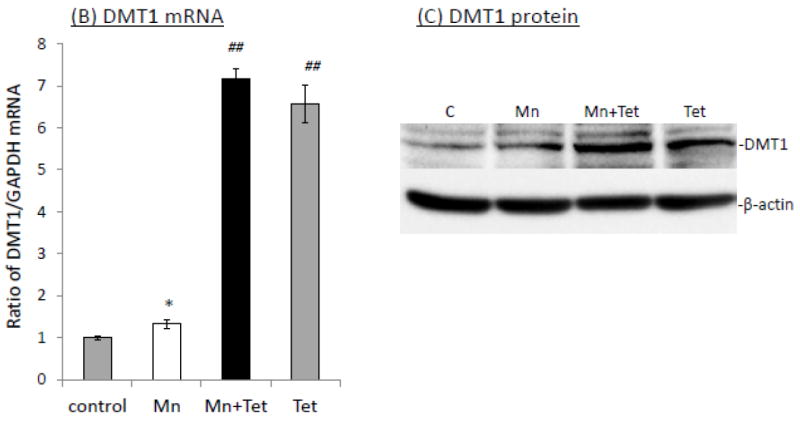
The homeostasis of copper (Cu) in the cerebrospinal fluid (CSF) is partially regulated by the Cu transporter-1 (CTR1) and divalent metal transporter-1 (DMT1) at the blood-CSF barrier (BCB) in the choroid plexus. Data from human and animal studies suggest an increased Cu concentration in blood, CSF, and brains following in vivo manganese (Mn) exposure. This study was designed to investigate the relative role of CTR1 and DMT1 in Cu transport under normal or Mn-exposed conditions using an immortalized choroidal Z310 cell line. Mn exposure in vitro resulted in an increased cellular 64Cu uptake and the up-regulation of both CTR1 and DMT1. Knocking down CTR1 by siRNA counteracted the Mn-induced increase of 64Cu uptake, while knocking down DMT1 siRNA resulted in an increased cellular 64Cu uptake in Mn-exposed cells. To distinguish the roles of CTR1 and DMT1 in Cu transport, the Z310 cell-based tetracycline (Tet)-inducible CTR1 and DMT1 expression cell lines were developed, namely iZCTR1 and iZDMT1 cells, respectively. In iZCTR1 cells, Tet induction led to a robust increase (25 fold) of 64Cu uptake with the time course corresponding to the increased CTR1. Induction of DMT1 by Tet in iZDMT1 cells, however, resulted in only a slight increase of 64Cu uptake in contrast to a substantial increase in DMT1 mRNA and protein expression. These data indicate that CTR1, but not DMT1, plays an essential role in transporting Cu by the BCB in the choroid plexus. Mn-induced cellular overload of Cu at the BCB is due, primarily, to Mn-induced over-expression of CTR1.


Conflict of interest statement

Disclosure of Conflict of Interest

The authors declare that there is no any conflict of interest with regards to financial, personal, or their relationships with other people or organizations for the studies presented in this article.

Figures

Fig. 1
Fig. 1
Increased Cu uptake in Z310 cells following Mn exposure in vitro. Z310 cells were treated with 100 μM Mn at time indicated, followed by the incubation with 5 mCi/ml 64Cu. The date represent Mean ± SE, n=8. *: p<0.05; **: p<0.01 as compared to controls.
Fig. 2
Fig. 2
Increased expression of CTR1 and DMT1 following Mn exposure. Z310 cells were treated with 100 μM Mn for the time indicated. The levels of mRNA were quantified by real-time RT-PCR and expressed as the ratio of CTR1/GAPDH and the protein expressions were investigated by Western blot. (A). CTR1 mRNA. (B) DMT1 mRNA. (C) CTR1 protein. The bar graph represents the optical density of CTR1 bands normalized by the optical density of the corresponding β-actin band (n=3). (D) DMT1 protein. The bar graph represents the optical density of DMT1 bands normalized by the corresponding β-actin band (n=3). Data represent mean ± SE, n=6; *: p<0.05; **: p<0.01 as compared to the controls.
Fig. 2
Fig. 2
Increased expression of CTR1 and DMT1 following Mn exposure. Z310 cells were treated with 100 μM Mn for the time indicated. The levels of mRNA were quantified by real-time RT-PCR and expressed as the ratio of CTR1/GAPDH and the protein expressions were investigated by Western blot. (A). CTR1 mRNA. (B) DMT1 mRNA. (C) CTR1 protein. The bar graph represents the optical density of CTR1 bands normalized by the optical density of the corresponding β-actin band (n=3). (D) DMT1 protein. The bar graph represents the optical density of DMT1 bands normalized by the corresponding β-actin band (n=3). Data represent mean ± SE, n=6; *: p<0.05; **: p<0.01 as compared to the controls.
Fig. 3
Fig. 3
Impact of siRNA knockdown of CTR1 on the Mn-induced cellular Cu accumulation. (A) siRNA knockdown of CTR1decreased the CTR1 mRNA transcription. Data represent mean ± SE, n=6; **: p<0.01 as compared to NC (negative control or scramble siRNA). (B) CTR1 protein levels were decreased following the siRNA treatment. (C) CTR1siRNA knockdown decreased cellular 64Cu uptake. Data represent mean ± SE, n=6; **: p<0.01 as compared to NC.
Fig. 3
Fig. 3
Impact of siRNA knockdown of CTR1 on the Mn-induced cellular Cu accumulation. (A) siRNA knockdown of CTR1decreased the CTR1 mRNA transcription. Data represent mean ± SE, n=6; **: p<0.01 as compared to NC (negative control or scramble siRNA). (B) CTR1 protein levels were decreased following the siRNA treatment. (C) CTR1siRNA knockdown decreased cellular 64Cu uptake. Data represent mean ± SE, n=6; **: p<0.01 as compared to NC.
Fig. 4
Fig. 4
Impacts of siRNA knockdown of DMT1 on the Mn-induced cellular Cu accumulation. (A) siRNA knockdown of DMT1 decreased the DMT1 mRNA transcription. Data represent mean ± SE, n=6; **: p<0.01 as compared to NC. (B) DMT1 protein levels were decreased following the siRNA treatment. (C) DMT1 siRNA knockdown failed to decrease the 64Cu uptake, but instead increased the cellular Cu uptake, as compared to controls and NC. Data represent mean ± SE, n=6. *: p<0.05 compared to the NC.
Fig. 4
Fig. 4
Impacts of siRNA knockdown of DMT1 on the Mn-induced cellular Cu accumulation. (A) siRNA knockdown of DMT1 decreased the DMT1 mRNA transcription. Data represent mean ± SE, n=6; **: p<0.01 as compared to NC. (B) DMT1 protein levels were decreased following the siRNA treatment. (C) DMT1 siRNA knockdown failed to decrease the 64Cu uptake, but instead increased the cellular Cu uptake, as compared to controls and NC. Data represent mean ± SE, n=6. *: p<0.05 compared to the NC.
Fig. 5
Fig. 5
Tet-induced overexpression of CTR1 in iZCTR1 cells and the ensuing increase of cellular 64Cu uptake. The iZCTR1 cells were treated with Tet at time “0”. (A) Time course of CTR1 mRNA expression following Tet induction. Data represent mean ± SE, n=6; *: p<0.05 as compared to controls. (B) Time course of CTR1 protein level following Tet addition. (C) Time course of the cellular 64Cu uptake in iZCTR1 cells following Tet induction; the bar graph depicts the 64Cu uptake of the “normal” Z310 cells treated with Tet for 24 h (n=6). Data represent Mean ± SE, n=6. **: p<0.01 compared to controls and the Tet-treated Z310 cells.
Fig. 5
Fig. 5
Tet-induced overexpression of CTR1 in iZCTR1 cells and the ensuing increase of cellular 64Cu uptake. The iZCTR1 cells were treated with Tet at time “0”. (A) Time course of CTR1 mRNA expression following Tet induction. Data represent mean ± SE, n=6; *: p<0.05 as compared to controls. (B) Time course of CTR1 protein level following Tet addition. (C) Time course of the cellular 64Cu uptake in iZCTR1 cells following Tet induction; the bar graph depicts the 64Cu uptake of the “normal” Z310 cells treated with Tet for 24 h (n=6). Data represent Mean ± SE, n=6. **: p<0.01 compared to controls and the Tet-treated Z310 cells.
Fig. 6
Fig. 6
Induction of CTR1 in iZCTR1 cells at the steady state of Mn exposure and the cellular Cu accumulation. The iZCTR1 cells were exposed to 100 μM Mn for 24 h, followed by Tet treatment for 4 h. (A) Tet induced a drastic increase Cu uptake following Mn exposure in CTR1-inducible cells. (B) Tet induction increased CTR1 mRNA level in the Mn-treated iZCTR1 cells. Data represent mean ± SE, n=6; *: p<0.05 compared to controls; ##: p<0.01 compared to Mn-treated group. (C) Tet induction increased CTR1 protein levels in the Mn-treated iZCTR1 cells.
Fig. 6
Fig. 6
Induction of CTR1 in iZCTR1 cells at the steady state of Mn exposure and the cellular Cu accumulation. The iZCTR1 cells were exposed to 100 μM Mn for 24 h, followed by Tet treatment for 4 h. (A) Tet induced a drastic increase Cu uptake following Mn exposure in CTR1-inducible cells. (B) Tet induction increased CTR1 mRNA level in the Mn-treated iZCTR1 cells. Data represent mean ± SE, n=6; *: p<0.05 compared to controls; ##: p<0.01 compared to Mn-treated group. (C) Tet induction increased CTR1 protein levels in the Mn-treated iZCTR1 cells.
Fig. 7
Fig. 7
Tet-induced overexpression of DMT1 in iZDMT1 cells and the ensuing increase of cellular 64Cu uptake. The iZDMT1 cells were treated with Tet at time “0”. (A) Time course of DMT1 expression following Tet induction. Data represent mean ± SE, n=6;**: p<0.01 compared to controls. (B) Time course of DMT1 protein level following Tet addition. (C) Time course of the cellular 64Cu uptake in iZDMT1 cells following Tet induction. Data represent Mean ± SE, n=6. *: p<0.05 compared to controls.
Fig. 7
Fig. 7
Tet-induced overexpression of DMT1 in iZDMT1 cells and the ensuing increase of cellular 64Cu uptake. The iZDMT1 cells were treated with Tet at time “0”. (A) Time course of DMT1 expression following Tet induction. Data represent mean ± SE, n=6;**: p<0.01 compared to controls. (B) Time course of DMT1 protein level following Tet addition. (C) Time course of the cellular 64Cu uptake in iZDMT1 cells following Tet induction. Data represent Mean ± SE, n=6. *: p<0.05 compared to controls.
Fig. 8
Fig. 8
Induction of DMT1 in iZDMT1 cells at the steady state of Mn exposure and the cellular Cu accumulation. The iZDMT1 cells were exposed to 100 μM Mn for 24 h, followed by Tet treatment for 4 h. (A) Tet induced the increase of Cu uptake in Mn-treated iZDMT1 cells. Data represent mean ± SE, n=6; **: p<0.01 compared to controls; #: p<0.05 compared to Mn-treated group. (B) Tet induction increased DMT1 mRNA levels in Mn-treated iZDMT1 cells. Data represent mean ± SE, n=6; *: p<0.05 compared to controls; ##: p<0.01 compared to Mn-treated group. (C) Tet induction increased DMT1 protein levels in Mn-treated iZDMT1 cells.
Fig. 8
Fig. 8
Induction of DMT1 in iZDMT1 cells at the steady state of Mn exposure and the cellular Cu accumulation. The iZDMT1 cells were exposed to 100 μM Mn for 24 h, followed by Tet treatment for 4 h. (A) Tet induced the increase of Cu uptake in Mn-treated iZDMT1 cells. Data represent mean ± SE, n=6; **: p<0.01 compared to controls; #: p<0.05 compared to Mn-treated group. (B) Tet induction increased DMT1 mRNA levels in Mn-treated iZDMT1 cells. Data represent mean ± SE, n=6; *: p<0.05 compared to controls; ##: p<0.01 compared to Mn-treated group. (C) Tet induction increased DMT1 protein levels in Mn-treated iZDMT1 cells.

References

    1. Aschner M, Nass R, Guilarte TR, Schneider JS, Zheng W. Manganese: Recent advances in understanding its transport and neurotoxicity. Toxicol Appl Pharmacol. 2007;221:131–147. - PMC - PubMed
    1. Beaudoin J, Thiele DJ, Labbé S, Puig S. Dissection of the relative contribution of the Schizosaccharomyces pombe Ctr4 and Ctr5 proteins to the copper transport and cell surface delivery functions. Microbiology. 2011;157:1021–1031. - PMC - PubMed
    1. Bertinato J, Swist E, Plouffe LJ, Brooks SP, L’abbé MR. Ctr2 is partially localized to the plasma membrane and stimulates copper uptake in COS-7 cells. Biochem J. 2008;409:731–740. - PubMed
    1. Boll MC, Alcaraz-Zubeldia M, Montes S, Rios C. Free copper, ferroxidase and SOD1 activities, lipid peroxidation and NO(x) content in the CSF. A different marker profile in four neurodegenerative diseases. Neurochem Res. 2008;33:1717–1723. - PubMed
    1. Choi BS, Zheng W. Copper transport to the brain by the blood-brain barrier and blood-CSF barrier. Brain Res. 2002;1248:14–21. - PMC - PubMed

Publication types