. 2012 Jun;50(6):1214-22.
doi: 10.1016/j.bone.2012.03.011. Epub 2012 Mar 19.

Chronic exposure to methylphenidate impairs appendicular bone quality in young rats

Affiliations

Chronic exposure to methylphenidate impairs appendicular bone quality in young rats

David E Komatsu et al. Bone. 2012 Jun.

Abstract

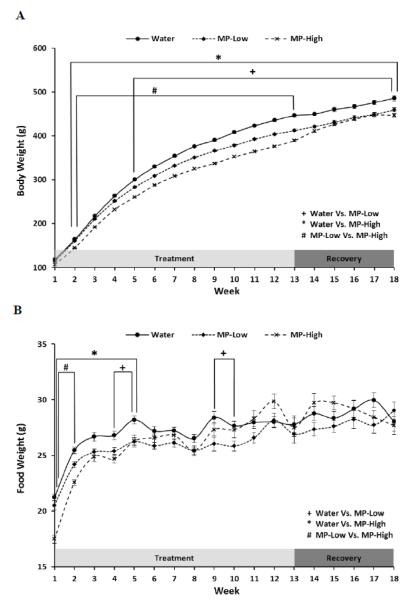
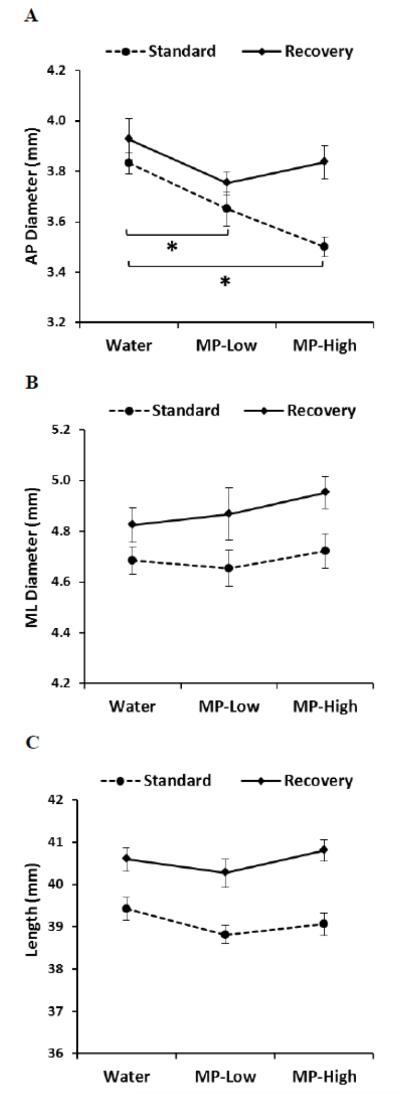
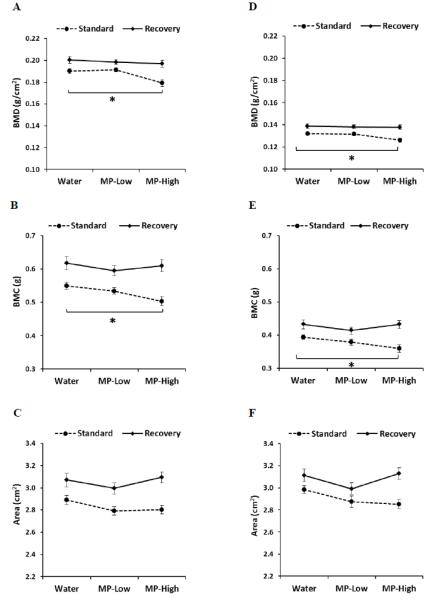
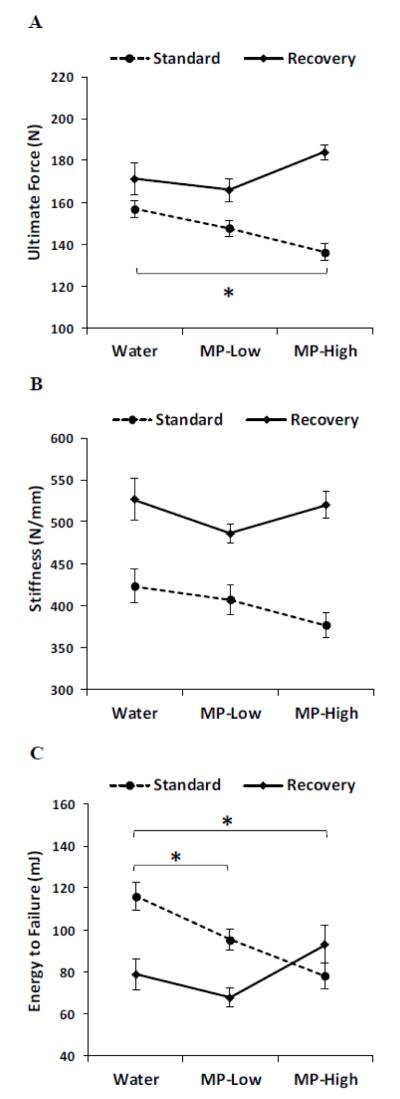
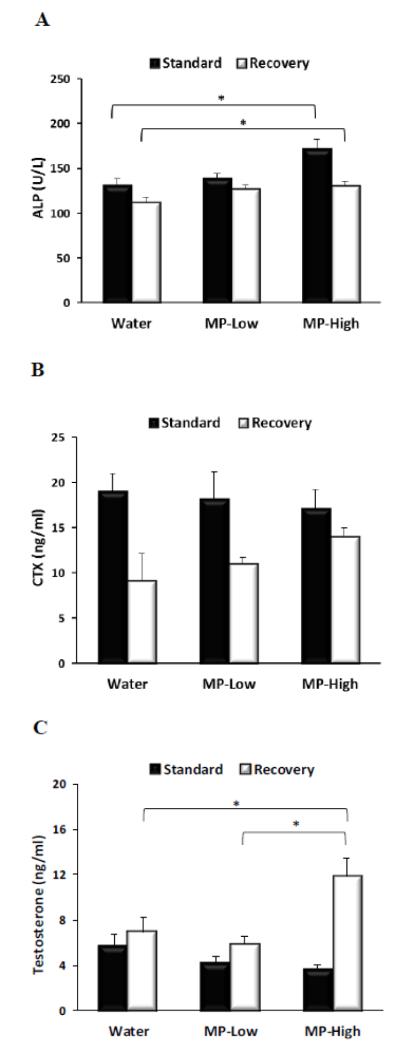
Methylphenidate (MP) is a psychostimulant widely prescribed to treat Attention Deficit Hyperactivity Disorder (ADHD). Although generally well tolerated, growth deficits have been reported in children and adolescents undergoing MP treatment. This study was designed to elucidate the skeletal effects of chronic MP administration in adolescent rats. Male, 4-week-old rats received one of two doses of MP (MP-Low or MP-High) delivered for 8 h a day via drinking water, or were untreated (water only). After 13 weeks, half were sacrificed (N=12/group) and the remaining rats were left to recover, untreated for 5 additional weeks. Femora, tibiae, and L5 vertebra were analyzed using calipers, DXA, and mechanical testing. Immediately following treatment, MP decreased femoral anterior-posterior diameter (5% and 9% for MP-Low and MP-High, respectively), femoral and tibial bone mineral density (BMD) (6% and 5% for MP-High femora and tibiae, respectively), and bone mineral content (BMC) (9% for MP-High femora and tibiae). In addition, femora from MP treated rats had reduced ultimate force (20% for MP-High) and energy to failure (20% and 33% for MP-Low and MP-High, respectively). However, after recovery, there were no statistically significant differences for any measured parameters. Despite these effects on the appendicular skeleton, no differences were identified between vertebral samples at either time-point. In summary, MP treatment resulted in smaller, less mineralized, and weaker bones at appendicular sites, but did not affect the axial site. Although these effects were ameliorated within 5 weeks, these data suggest that adolescents undergoing MP treatment may be at an increased risk for long bone fractures.


Figures

Figure 1
Figure 1. Body Weight and Food Intake
Line graphs showing: A) Body weight, and; B) Food intake; for the three treatment groups (Water, MP-Low, and MP-High) during the 13 weeks of treatment and 5 weeks of untreated recovery. Markers indicate average weekly weight for each group with error bars denoting SEM. Results were compared between treatment groups each week using 2-way repeated measures ANOVA, followed by pairwise comparisons using the Holm-Sidak method. All comparisons were considered significant for p-values < 0.05. Weeks in which results significantly differed are spanned by brackets and marked with symbols to identify the groups that differed.
Figure 2
Figure 2. Femoral Caliper Measurements
Line graphs showing results of caliper measurements of femoral: A) Anterior-posterior (AP) diameter; B) Medial-lateral (ML) diameter, and; C) Length; for the three treatment groups (Water, MP-Low, and MP-High) analyzed immediately after 13 weeks of treatment (Standard) and following 5 weeks of untreated recovery (Recovery). Markers indicate group average with error bars denoting SEM. Results were compared between groups within each dosing protocol using ANOVA, followed by pairwise comparisons with Dunnett’s tests. All comparisons were considered significant for p-values < 0.05. Significant differences between treatment groups from the standard protocol are indicated by brackets and asterisks.
Figure 3
Figure 3. Femoral and Tibial DXA Analyses
Line graphs displaying results of dual energy x-ray absorptiometry (DXA) determination of: A) Femoral bone mineral density (BMD); B) Femoral bone mineral content (BMC); C) Femoral area; D) Tibial BMD; E) Tibial BMC, and; F) Tibial area; for the three treatment groups (Water, MP-Low, and MP-High) analyzed immediately after 13 weeks of treatment (Standard) and following 5 weeks of untreated recovery (Recovery). Markers indicate group average with error bars denoting SEM. Results were compared between groups within each dosing protocol using ANOVA, followed by pairwise comparisons with Dunnett’s tests. All comparisons were considered significant for p-values < 0.05. Significant differences between treatment groups from the standard protocol are indicated by brackets and asterisks.
Figure 4
Figure 4. Femoral Biomechanical Testing
Line graphs showing results of femoral biomechanical testing for the parameters of: A) Ultimate force; B) Stiffness, and; C) Energy to failure; for the three treatment groups (Water, MP-Low, and MP-High) analyzed immediately after 13 weeks of treatment (Standard) and following 5 weeks of untreated recovery (Recovery). Markers indicate group average with error bars denoting SEM. Results were compared between groups within each dosing protocol using ANOVA, followed by pairwise comparisons with Dunnett’s tests. All comparisons were considered significant for p-values < 0.05. Significant differences between treatment groups from the standard protocol are indicated by brackets and asterisks.
Figure 5
Figure 5. Serum Biomarkers
Bar graphs displaying serum levels of: A) Alkaline phosphatase (ALP); B) Carboxy-terminal collagen crosslinks (CTX) and; C) Testosterone, for the three treatment groups (Water, MP-Low, and MP-High) analyzed immediately after 13 weeks of treatment (Standard) and following 5 weeks of untreated recovery (Recovery). Markers indicate group average with error bars denoting SEM. Results were compared between groups within each dosing protocol using ANOVA (ALP and Testosterone) and Kruskal-Wallis tests (CTX), followed by pairwise comparisons with Dunnett’s tests. All comparisons were considered significant for p-values < 0.05. Significant differences between groups are indicated by brackets and asterisks.

References

    1. Dopheide JA, Pliszka SR. Attention Deficit Hyperactivity Disorder: An Update. Pharmacotherapy. 2009;29:656–679. - PubMed
    1. Loe IM, Feldman HM. Academic and educational outcomes of children with ADHD. J. Pediatr. Psychol. 2007;32:643–654. - PubMed
    1. Edwards G, Barkley RA, Laneri M, Fletcher K, Metevia L. Parent-adolescent conflict in teenagers with ADHD and ODD. J. Abnorm. Child. Psychol. 2001;29:557–572. - PubMed
    1. Konofal E, Lecendreux M, Cortese S. Sleep and ADHD. Sleep. Med. 2010;11:652–658. - PubMed
    1. Mannuzza S, Klein RG, Moulton JL. 3rd, Lifetime criminality among boys with attention deficit hyperactivity disorder: a prospective follow-up study into adulthood using official arrest records. Psychiatry. Res. 2008;160:237–246. - PMC - PubMed

Publication types

MeSH terms