. 2012 Jun;191(2):435-49.
doi: 10.1534/genetics.112.138958. Epub 2012 Mar 30.

Analysis of Cryptococcus neoformans sexual development reveals rewiring of the pheromone-response network by a change in transcription factor identity

Affiliations

Analysis of Cryptococcus neoformans sexual development reveals rewiring of the pheromone-response network by a change in transcription factor identity

Emilia K Kruzel et al. Genetics. 2012 Jun.

Abstract

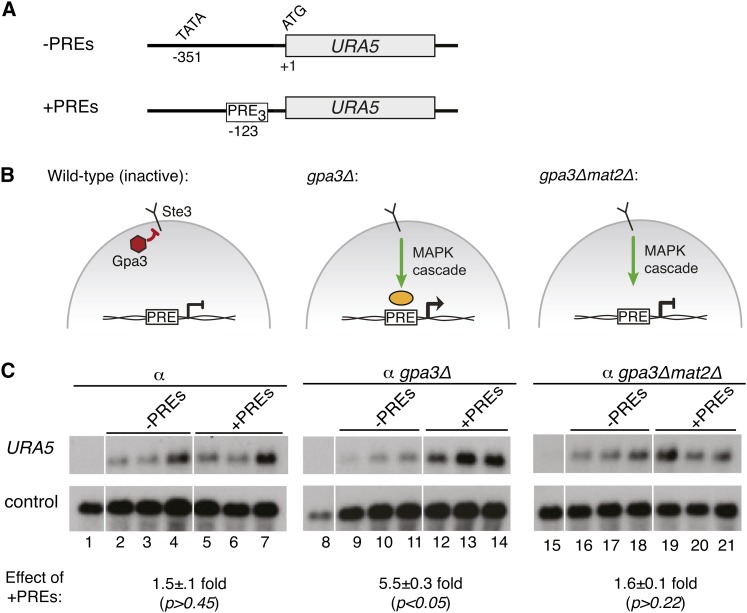
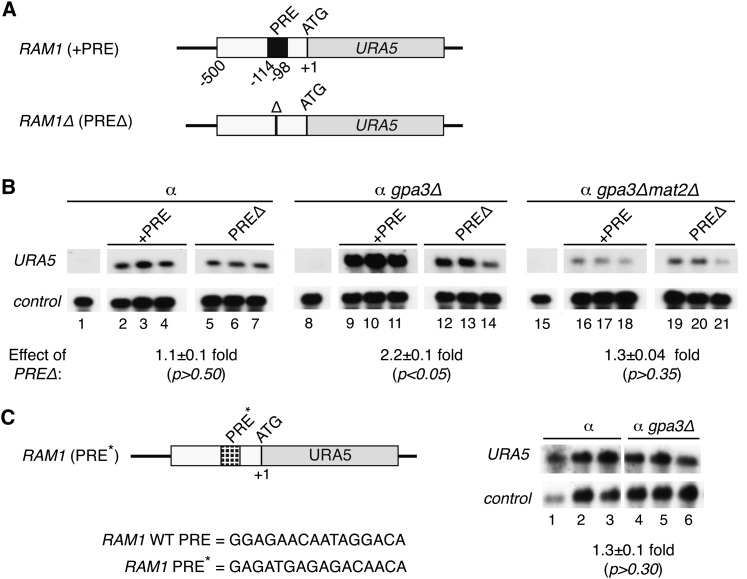
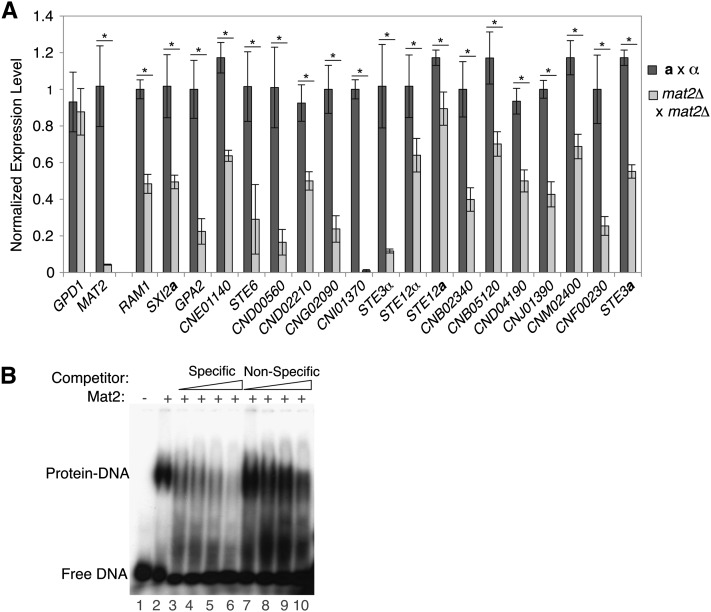
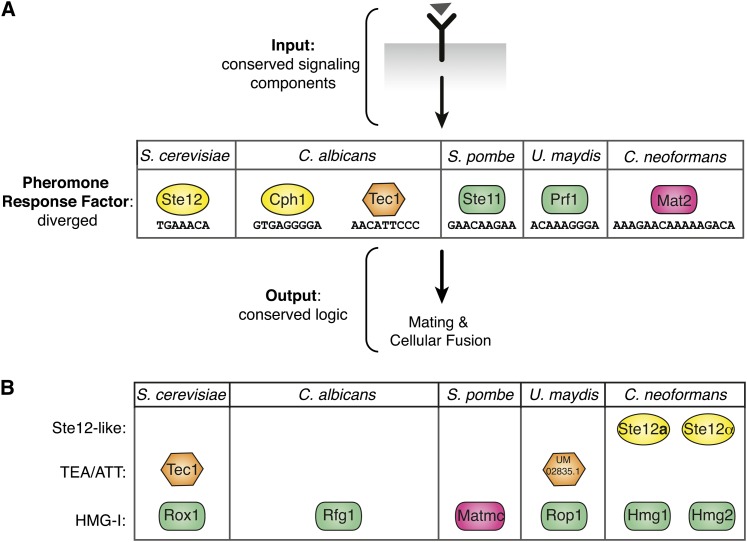
The fundamental mechanisms that control eukaryotic development include extensive regulation at the level of transcription. Gene regulatory networks, composed of transcription factors, their binding sites in DNA, and their target genes, are responsible for executing transcriptional programs. While divergence of these control networks drives species-specific gene expression that contributes to biological diversity, little is known about the mechanisms by which these networks evolve. To investigate how network evolution has occurred in fungi, we used a combination of microarray expression profiling, cis-element identification, and transcription-factor characterization during sexual development of the human fungal pathogen Cryptococcus neoformans. We first defined the major gene expression changes that occur over time throughout sexual development. Through subsequent bioinformatic and molecular genetic analyses, we identified and functionally characterized the C. neoformans pheromone-response element (PRE). We then discovered that transcriptional activation via the PRE requires direct binding of the high-mobility transcription factor Mat2, which we conclude functions as the elusive C. neoformans pheromone-response factor. This function of Mat2 distinguishes the mechanism of regulation through the PRE of C. neoformans from all other fungal systems studied to date and reveals species-specific adaptations of a fungal transcription factor that defies predictions on the basis of sequence alone. Overall, our findings reveal that pheromone-response network rewiring has occurred at the level of transcription factor identity, despite the strong conservation of upstream and downstream components, and serve as a model for how selection pressures act differently on signaling vs. gene regulatory components during eukaryotic evolution.


Figures

Figure 1
Figure 1
Distinct cell types and multicellular structures form during C. neoformans sexual development. (A) Schematic of sexual development. Haploid yeast of different mating types (a and α) encounter one another and fuse. The fusant then grows filamentously until a basidium forms on the terminal filament cell in which meiosis occurs (nodules on the sides of filaments represent clamp cells). The haploid recombinant progeny are packaged into spores and presented on the basidium surface in long chains. (B) Light microscopy of a sexually developing population on V8 juice agar medium, with images taken at 0.5 (i), 6 (ii), 12 (iii), 24 (iv), 48 (v), and 72 (vi) hours postmixing of the a × α cross (200× magnification), each showing the appearance of a new developmental cell type and corresponding to the schematic in A.
Figure 2
Figure 2
Developmental microarray data set defines eight stage-specific gene clusters. The top 3157 genes (as filtered by statistical significance and fold change) are represented as rows, and experiments as columns (labeled above). Yellow indicates an increase over the time period being assessed, blue indicates a decrease, and black indicates that the transcript level was unchanged between time points. The genes are arranged vertically into groups with similar expression profiles, as defined by a robust K-means clustering algorithm (1000 iterations, Pearson correlation similarity metric) with cluster designations on the left (1–8) and representative significantly enriched GO terms (P < 0.05) on the right (Ausubel et al. 1997).
Figure 3
Figure 3
The C. neoformans PRE sequence is similar to those of other fungi. (A) Logo of the C. neoformans PRE generated by MEME, shown in forward and reverse complement permutations, with heights of letters corresponding to incidence of a given base at that position (WebLogo assembled from PREs listed in Table 1). The PRE shows no strand bias upstream of target genes and appears in both the A-rich and T-rich permutations on the 5′ strand upstream of target genes. (B) The C. neoformans consensus PRE and those of previously described fungi (Dolan et al. 1989; Sugimoto et al. 1991; Urban et al. 1996; Sahni et al. 2009). (C) Schematic of the PRE content upstream of target genes of particular interest. Shaded arrows represent open reading frames, horizontal lines represent intergenic spaces, and red and green rectangles are representative of PREs, with colors corresponding to direction of PRE as pictured in A. Mating pheromone and receptor genes harbored the most PREs in their upstream regions. Interestingly, orthologous mating-type-specific genes contain differential PRE content, indicating potential regulatory divergence between mating types (e.g., STE3a vs. STE3α).
Figure 4
Figure 4
The PRE is sufficient to confer activation of a reporter gene during sexual development. (A) Schematic of constructs used in this assay, showing the reporter gene (URA5), translational start (ATG), and predicted transcriptional start (TATA). The top construct is the control and lacks PREs. The bottom construct includes two PRE insertion sites: three tandem PREs at −123 and four tandem PREs at −534 (PRE sequence = AACAAAAGACA) (B) Schematic of the pheromone response in C. neoformans. The pheromone-response pathway is inactive in the absence of a mating partner (left). In the presence of a mating partner, the pheromone-signaling pathway is activated (right). (C) Northern blot of reporter and control transcript levels. Wild-type and +PRE reporters were expressed in α ura5 strains (three independently isolated strains were assessed for each reporter construct). The resulting reporter strains were incubated alone (lanes 1–7) or in the presence of a mating partner (lanes 8–14). Lanes 1 and 8 show the parental strains lacking reporter plasmid. A probe to URA5 detected reporter readout and a probe to ADE2 served as an internal control. In each case, URA5 levels were normalized to ADE2 levels and mean expression values were compared between sets of biological triplicates to determine fold change with standard error (shown under northern blots). Student’s t-test was used to determine the statistical significance of the differences between mean values among sets of biological triplicates.
Figure 5
Figure 5
The PRE activates transcription in response to pheromone signaling. (A) Schematic of constructs used in this assay, showing the reporter gene (URA5), translational start (ATG), and predicted transcriptional start (TATA). The top construct is the control, and lacks PREs. The bottom construct includes an insertion of three tandem PREs at −123 (PRE sequence = ATTAAACAAAAAGAAA). (B) Representation of the pheromone response in C. neoformans. Gpa3 represses MAPK signaling in the absence of pheromone ligand (left). gpa3Δ mimics pheromone activation (middle) (Hsueh et al. 2007). gpa3Δmat2Δ is predicted to eliminate signaling through PREs (right). (C) Northern blot of reporter and control transcript levels. Wild-type and +PRE reporters were expressed in ura5 (lanes 2–7), gpa3Δura5 (lanes 9–14), and gpa3Δmat2Δura5 (lanes 16–21) strains (three independently isolated strains were assessed for each reporter construct in each genetic background). Lanes 1, 8, and 15 show the parental strains lacking reporter plasmid. A probe to URA5 detected reporter readout and a probe to GPD1 served as a control. In each case, URA5 levels were normalized to GPD1 levels and mean expression values were compared between sets of biological triplicates to determine fold change with standard error (shown under Northern blots). Student’s t-test was used to determine the statistical significance of the differences between mean values among sets of biological triplicates.
Figure 6
Figure 6
The induction of the RAM1 promoter in response to pheromone signaling requires the endogenous PRE and Mat2. (A) Schematic of the reporter constructs used in this assay, showing the reporter gene (URA5), translational start (ATG), and location of endogenous PRE within the RAM1 promoter (PRE sequence = GGAGAACAATAGGACA). PREΔ indicates deletion of the 16-bp PRE. (B) Northern blot of reporter and control transcript levels. Reporter constructs with and without the PRE were transformed into ura5 (lanes 2–7), gpa3Δura5 (lanes 9–14), and gpa3Δmat2Δura5 (lanes 16–21) strains (three independently isolated strains were assessed for each reporter construct in each genetic background). Lanes 1, 8, and 15 show the parental strains lacking reporter plasmid. A probe to URA5 detected reporter readout and a probe to GPD1 served as a control. In each case, URA5 levels were normalized to GPD1 levels and mean expression values were compared between sets of biological triplicates to determine fold change with standard error (shown under Northern blots). Student’s t-test was used to determine the statistical significance of the differences between mean values among sets of biological triplicates. (C) Schematic of a mutant reporter construct, showing the reporter gene (URA5), translational start (ATG), and location of the randomized PRE (PRE*) within the RAM1 promoter (PRE* = GAGATGAGAGACAACA). Northern blot of wild-type (lanes 1–3) and gpa3Δ (lanes 4–6) strains expressing the RAM1 PRE* reporter construct. Similar to B, URA5 levels served as the reporter readout and were normalized to control gene GPD1.
Figure 7
Figure 7
Mat2 is required for the expression of PRE-containing genes and binds specifically to the PRE. (A) qRT-PCR analysis of PRE-containing target genes in wild-type (dark gray bars) and mat2Δ (light gray bars) crosses. Expression levels presented on the y-axis are mean values (of triplicate experiments), normalized to internal reference gene URA5, with associated standard error. Student’s t-test was used to determine if the expression levels were statistically different between the wild-type and mat2Δ crosses (* indicates P < 0.05). (B) Recombinantly expressed Mat2 protein was incubated with radiolabeled probe corresponding to the MFα1 PRE. Lane 1 contains the probe without protein, and lanes 2–10 contain constant amounts of recombinant Mat2. The formation of the Mat2–DNA complex (lane 2) is diminished by the addition of increasing amounts of unlabeled specific competitor DNA corresponding to MFα1 PRE sequence (lanes 3–6). Increasing amounts of unlabeled nonspecific competitor DNA (similarly sized fragment of the pUC18 vector) did not have this effect (lanes 7–10). Competitor DNA was added at 40×, 200×, 400×, and 800× molar excess.
Figure 8
Figure 8
Evolution of the fungal pheromone-response pathway has occurred at the level of the pheromone-response factor. (A) Diverged transcription factors function as pheromone-response factors across fungal systems. The pheromone signal (triangle) is transduced via a conserved receptor and MAPK cascade signaling components, identifiable by sequence homology (conserved input). The transcription factor mediating the conserved response shows divergence among the species characterized (colored shapes representing diverged pheromone-response factors). Responses downstream of the pheromone-response factor are conserved across species (conserved output). Colored shapes (indicating type of DNA-binding domain) with species-specific designations represent the various pheromone-response factors and their binding sites. (B) Rewiring of transcription-factor function. Highest reciprocal BLAST hits were used to identify other predicted DNA-binding proteins with high sequence similarity to the pheromone-response factors in fungi. These factors are present in the genome but have been shown to control different pathways (not pheromone response). C. neoformans is unique because it encodes numerous homologs of the Ste12-like (Ste12a and Ste12α) and HMG-domain (Hmg1 and Hmg2) pheromone-response factors of other fungi, yet uses the diverged HMG-domain protein Mat2 as its pheromone-response factor. Key for DNA binding classes: yellow ovals, Ste12 like; orange hexagon, TEA/ATT; green rectangles, HMG-I; pink rectangles, HMG-I (diverged).

References

    1. Alspaugh J., Davidson R., Heitman J., 2000. Morphogenesis of Cryptococcus neoformans. Contrib. Microbiol. 5: 217–238 - PubMed
    1. Alspaugh J. A., Perfect J. R., Heitman J., 1997. Cryptococcus neoformans mating and virulence are regulated by the G-protein α subunit Gpa1 and cAMP. Genes Dev. 11: 3206–3217 - PMC - PubMed
    1. Ashburner M., Ball C. A., Blake J. A., Botstein D., Butler H., et al. , 2000. Gene ontology: tool for the unification of biology: The Gene Ontology Consortium. Nat. Genet. 25: 25–29 - PMC - PubMed
    1. Ausubel F., Brent R., Kingston R., Moore D., Seidman J., et al. (Editors), 1997. Current Protocols in Molecular Biology. Wiley, New York
    1. Bailey T. L., Elkan C., 1994. Fitting a mixture model by expectation maximization to discover motifs in biopolymers, 28–36 Proceedings of the Second International Conference on Intelligent Systems for Molecular Biology. AAAI Press, Palo Alto, CA - PubMed

Publication types

MeSH terms