. 2012 May;15(5):763-8.
doi: 10.1038/nn.3081.

Oscillatory dynamics in the hippocampus support dentate gyrus–CA3 coupling

Affiliations

Oscillatory dynamics in the hippocampus support dentate gyrus–CA3 coupling

Thomas Akam et al. Nat Neurosci. 2012 May.

Abstract

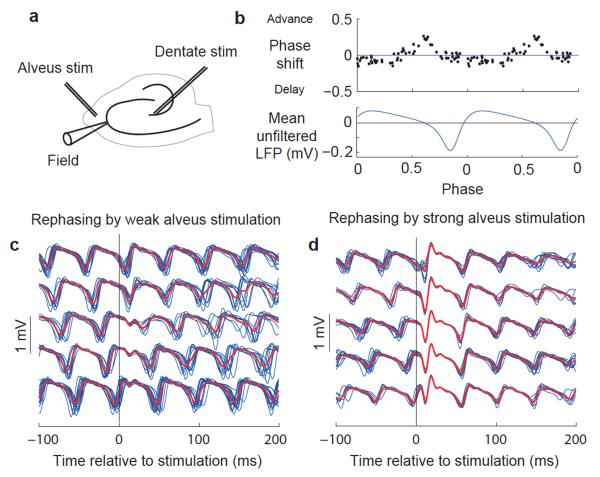
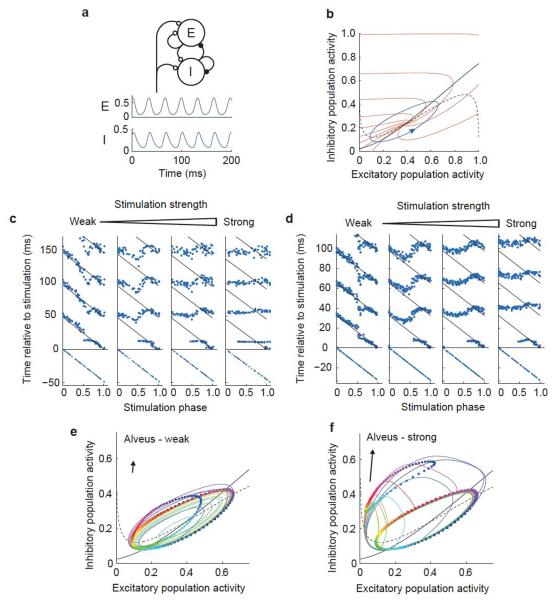
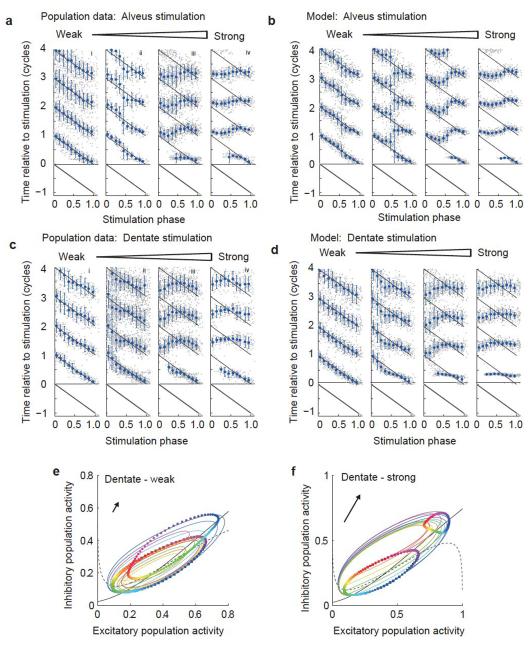
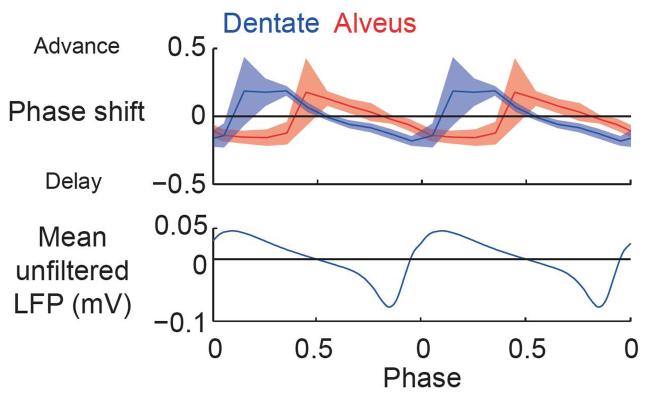
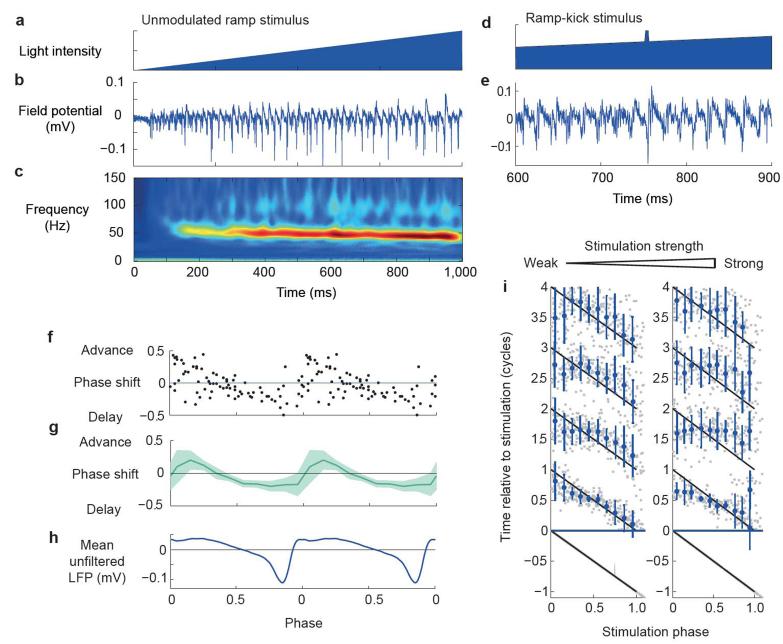
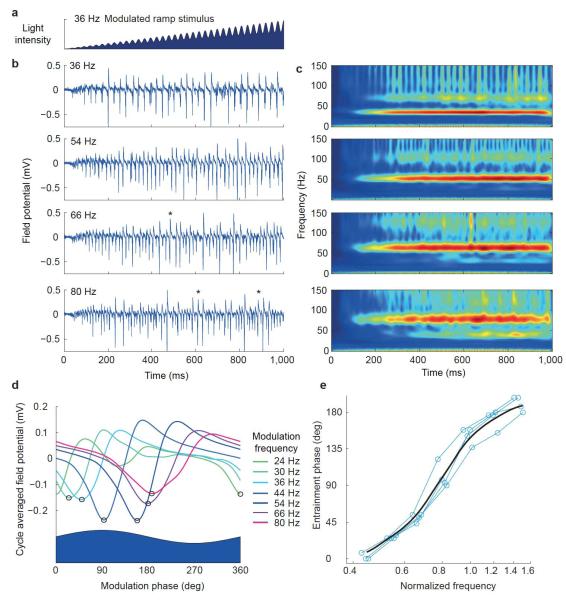
Gamma oscillations in the dentate gyrus and hippocampal CA3 show variable coherence in vivo, but the mechanisms and relevance for information flow are unknown. We found that carbachol-induced oscillations in rat CA3 have biphasic phase-response curves, consistent with the ability to couple with oscillations in afferent projections. Differences in response to stimulation of either the intrinsic feedback circuit or the dentate gyrus were well described by varying an impulse vector in a two-dimensional dynamical system, representing the relative input to excitatory and inhibitory neurons. Responses to sinusoidally modulated optogenetic stimulation confirmed that the CA3 network oscillation can entrain to periodic inputs, with a steep dependence of entrainment phase on input frequency. CA3 oscillations are therefore suited to coupling with oscillations in the dentate gyrus over a broad range of frequencies.


Figures

Figure 1
Figure 1
Measurement of network PRCs in the hippocampal CA3 subfield. (a) Schematic indicating positions of recording and stimulating electrodes. (b) PRC with weak stimulation, aligned with average unfiltered LFP over two cycles. (c) Filtered LFP traces (blue) around weak alveus stimulation in a representative experiment, sorted into five groups by phase of stimulation with group averages superimposed (red). (d) Data obtained and plotted as in c, but with strong alveus stimulation.
Figure 2
Figure 2
A neural mass model reproduces rephasing behavior. (a) Schematic illustrating the Wilson-Cowan model (top), with activity of excitatory (E) and inhibitory (I) populations in the absence of noise or perturbation (below). (b) Phase plane diagram showing the limit cycle (blue), nullclines (black: dashed, excitatory; solid, inhibitory; see Online Methods) and isochrons (red). (c) Rephasing by stimuli of four different strengths in one hippocampal slice. Points indicate the troughs of the filtered LFP, with the last trough before stimulation and 3–4 troughs after stimulation shown for each trial. Times of successive troughs (sequences of points running vertically) are arranged on the x axis by phase of stimulation. Diagonal lines indicate the expected positions of troughs in the absence of stimulation, calculated from the time of the final trough before the stimulus and the mean unperturbed period duration. (d) Rephasing behavior of Wilson-Cowan model in response to perturbations of different intensities, plotted as in c. (e,f) Rephasing phase plane diagrams. Colored squares show positions at the time of stimulation for 100 simulations, equally spaced in phase. Correspondingly colored circles show the state 6 ms after the stimulus. Colored lines show trajectories of ten of these simulations from the time of stimulation until their return to the limit cycle. Arrows indicate the direction (ratio of inhibitory to excitatory stimuli) and strength of the input pulse (also see Supplementary Movie 1a,b).
Figure 3
Figure 3
Population data and model behavior. (ad) Population rephasing data for alveus (a,b) and dentate stimuli (c,d). Experimental data are shown in a and c, and simulation results are shown in b and d. Gray dots indicate times of troughs in individual traces, plotted as in Figure 1c, but combining data across experiments. Blue symbols indicate the circular mean trough position for data binned by phase of stimulation (error bars indicate circular variance). (e,f) Rephasing phase plane diagrams for dentate stimulation, plotted as in Figure 2e,f. Note the difference in stimulation angle (indicated by arrow) compared with alveus stimulation.
Figure 4
Figure 4
Population PRCs for weak dentate and alveus stimulation with circular 95% confidence interval, and the cycle-averaged unfiltered LFP shown for reference.
Figure 5
Figure 5
Optogenetic rephasing. (ac) Example of oscillatory activity evoked by 1-s light ramp showing light intensity (a), LFP (b) and average wavelet transform amplitude (c; 12 traces from 1 slice). (d,e) Example of rephasing using a ramp-kick stimulus showing light intensity time course (d) and field potential (e) during a 400-ms window around the kick. (fh) PRC for single slice (f) and population (g) (n = 4, shaded area indicates 95% circular confidence interval) aligned with mean unfiltered LFP response (h). (i) Population rephasing data for weak (left) and strong (right) stimuli, plotted as in Figure 3.
Figure 6
Figure 6
Entrainment demonstrated with modulated light ramps. (a) Example of modulated ramp stimulus light intensity. (b) Example LFP traces elicited by modulated ramp stimuli at a range of modulation frequencies (frequency indicated by each panel). Asterisks indicate cycles with 1:2 entrainment. (c) Corresponding average wavelet transform amplitudes (n = 4). (d) Example average LFP responses as a function of phase of the sinusoidally modulated stimulus, for a range of frequencies indicated by trace color. Black circles indicate troughs used to evaluate entrainment phase. (e) Entrainment phase plotted as function of normalized modulation frequency; blue lines show individual slice data and black curve shows Gaussian weighted moving average.

References

    1. Bragin A, et al. Gamma (40–100 Hz) oscillation in the hippocampus of the behaving rat. J. Neurosci. 1995;15:47–60. - PMC - PubMed
    1. Csicsvari J, Jamieson B, Wise KD, Buzsaki G. Mechanisms of gamma oscillations in the hippocampus of the behaving rat. Neuron. 2003;37:311–322. - PubMed
    1. Montgomery SM, Sirota A, Buzsáki G. Theta and gamma coordination of hippocampal networks during waking and rapid eye movement sleep. J. Neurosci. 2008;28:6731–6741. - PMC - PubMed
    1. Montgomery SM, Buzsaki G. Gamma oscillations dynamically couple hippocampal CA3 and CA1 regions during memory task performance. Proc. Natl. Acad. Sci. USA. 2007;104:14495–14500. - PMC - PubMed
    1. Fell J, et al. Human memory formation is accompanied by rhinal-hippocampal coupling and decoupling. Nat. Neurosci. 2001;4:1259–1264. - PubMed

Publication types

MeSH terms

Substances