Review
. 2012 Apr;122(4):1180-8.
doi: 10.1172/JCI58649. Epub 2012 Apr 2.

Multiple sclerosis

Affiliations
Review

Multiple sclerosis

Alyssa Nylander et al. J Clin Invest. 2012 Apr.

Abstract

Multiple sclerosis (MS) is a multifocal demyelinating disease with progressive neurodegeneration caused by an autoimmune response to self-antigens in a genetically susceptible individual. While the formation and persistence of meningeal lymphoid follicles suggest persistence of antigens to drive the continuing inflammatory and humoral response, the identity of an antigen or infectious agent leading to the oligoclonal expansion of B and T cells is unknown. In this review we examine new paradigms for understanding the immunopathology of MS, present recent data defining the common genetic variants underlying disease susceptibility, and explore how improved understanding of immune pathway disruption can inform MS prognosis and treatment decisions.


Figures

Figure 1
Figure 1. Clonally related B cells populate the brain parenchyma, plaques, normal-appearing white matter (NAWM), meninges, and CSF in MS.
Analysis of the B cell repertoires derived from the meninges, plaques, NAWM, and CSF from brains of 11 individuals with MS demonstrated that the majority of the B cells resided exclusively in one area, but a small proportion of clones were shared among different locations. Analysis of a clonally expanded B cell subset revealed that 39%–62% of these clones populated different locations within the MS CNS. Reproduced with permission from Brain (41).
Figure 2
Figure 2. Defects in peripheral immune regulation lower the activation barrier for autoreactive T cells.
(A) In normal homeostasis, APCs digest microbial antigens or self proteins and present them to naive T cells in the context of co-stimulatory molecules. An appropriate cytokine milieu can drive differentiation of these naive autoreactive T cells to a Th1 or Th17 cell phenotype; however, these potentially pathogenic T cells are not activated due to the actions of peripheral regulatory immune cell populations, such as FoxP3+ Tregs and Tr1 cells. Via the actions of co-inhibitory molecules and cytokines such as IL-10 and TGF-β, autoreactive T cells become anergic and autoimmune disease is prevented. Other mechanisms, such as thymic deletion and lack of co-stimulatory molecules on APCs, are also involved in controlling autoreactive T cells. (B) MS patients have defects in peripheral immune regulation, including higher expression of co-stimulatory molecules on APCs, lower CTLA-4 levels, and lower IL-10 production. Additionally, MS patients have an increased frequency of IFN-γ–secreting Tregs relative to healthy controls. Thus, the barrier for activation of autoreactive T cells is lowered for MS patients. Activated myelin-reactive T cells can then adhere to and extravasate across the choroid plexus and BBB, where they can initiate an inflammatory milieu that gives license to further waves of inflammation and eventual epitope spreading.
Figure 3
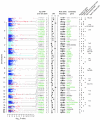
Figure 3. Genome regions showing association with MS.
Evidence for association from linear mixed model analysis of the discovery data (thresholded at a –log10 P value of 12) is shown at left. Non-MHC regions containing associated SNPs are indicated in red and labeled with the rs number (green text for newly identified loci, black text for loci with strong evidence of association, and gray text for previously reported loci) and risk allele of the most significant SNP. Asterisks indicate that the locus contains a secondary SNP signal. Odds ratios (ORs; diamonds) and 95% confidence intervals (whiskers) are estimated from a meta-analysis of discovery and replication data (+ indicates estimates for previously known loci from discovery data only). Risk allele frequency estimates in the control populations are indicated by vertical bars (scale of 0 to 1, left to right). A candidate gene and the number of genes are reported for each region of association. Black dots indicate that the candidate gene is physically the nearest gene included in the GO immune system process term. “Tags functional SNP” indicates whether the most-significant SNP tags a SNP predicted to affect the function of the candidate gene. Where such a SNP exists, the gene is selected as the candidate gene; otherwise, the nearest gene is selected unless there are strong biological reasons for a different choice. The final column indicates whether SNPs are correlated (r2 > 0.1) with SNPs associated with other autoimmune diseases. CeD, celiac disease; CrD, Crohn’s disease; PS, psoriasis; RA, rheumatoid arthritis; T1D, type 1 diabetes; UC, ulcerative colitis. Reproduced with permission from Nature (86).
Figure 4
Figure 4. Tregs from individuals with RRMS secrete IFN-γ ex vivo.
(A) The frequency of FACS-sorted IFN-γ+ and IL-17+ Tregs in healthy control individuals (left) and untreated individuals with RRMS (middle, n = 17) gated on Foxp3+ Tregs. Results are shown at right from a purity analysis of the sorted IFN-γ+Foxp3+ and IFN-γFoxp3+ populations from subjects with RRMS used for the methylation analysis described in C. (B) Percentage of IFN-γ+Foxp3+ and IL-17+Foxp3+ Tregs (n = 17) as a proportion of total Foxp3+ Tregs. (C) Representative example of methylation analysis of the Treg cell-specific demethylated region of the FOXP3 locus in sorted IFN-γ+Foxp3+ and IFN-γFoxp3+ Tregs from subjects with RRMS. An analysis of IFN-γ+Foxp3 memory T cells from subjects with RRMS is shown as a control. (D) Proliferation of responder T cells (Tresp) cultured with ex vivo FACS-sorted Tregs from healthy control subjects and untreated subjects with MS (Treg/Tresp ratio of 1:2) in the presence or absence of an IFN-γ–specific antibody (n = 4). (E) The frequency of IFN-γ+ and IL-17+ Tregs in healthy control subjects (left) or IFN-β–treated patients with RRMS (right) as assessed by intracellular cytokine staining and FACS analysis. The bar diagram (right) shows the percentage of IFN-γ+Foxp3+ and IL-17+Foxp3+ cells as a proportion of total Foxp3+ Tregs in healthy controls or IFN-β–treated patients with RRMS (n = 12). Reproduced with permission from Nature Medicine (91).

References

    1. Hafler DA. Multiple sclerosis. J Clin Invest. 2004;113(6):788–794. - PMC - PubMed
    1. Jones JL, et al. Improvement in disability after alemtuzumab treatment of multiple sclerosis is associated with neuroprotective autoimmunity. Brain. 2010;133(pt 8):2232–2247. doi: 10.1093/brain/awq176. - DOI - PubMed
    1. Gunnarsson M, et al. Axonal damage in relapsing multiple sclerosis is markedly reduced by natalizumab. Ann Neurol. 2011;69(1):83–89. doi: 10.1002/ana.22247. - DOI - PubMed
    1. Miller DH, Leary SM. Primary-progressive multiple sclerosis. Lancet Neurol. 2007;6(10):903–912. doi: 10.1016/S1474-4422(07)70243-0. - DOI - PubMed
    1. McDonald WI, et al. Recommended diagnostic criteria for multiple sclerosis: guidelines from the International Panel on the diagnosis of multiple sclerosis. Ann Neurol. 2001;50(1):121–127. doi: 10.1002/ana.1032. - DOI - PubMed

Publication types

MeSH terms