. 2012 May;18(5):807-815.
doi: 10.1038/nm.2700.

Editing T cell specificity towards leukemia by zinc finger nucleases and lentiviral gene transfer

Affiliations

Editing T cell specificity towards leukemia by zinc finger nucleases and lentiviral gene transfer

Elena Provasi et al. Nat Med. 2012 May.

Abstract

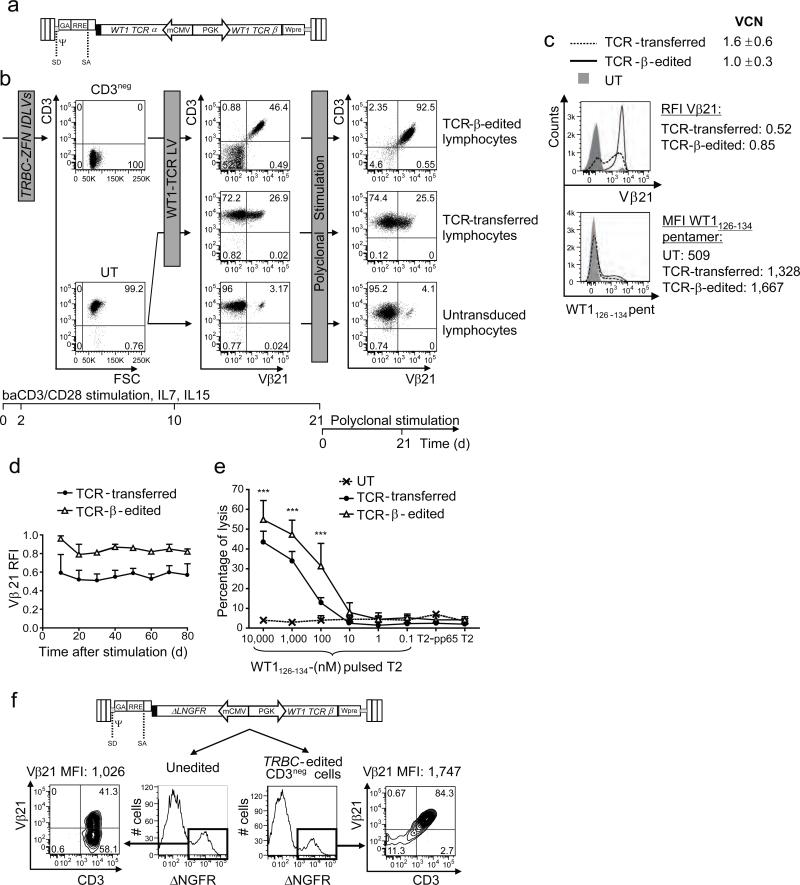
The transfer of high-avidity T cell receptor (TCR) genes isolated from rare tumor-specific lymphocytes into polyclonal T cells is an attractive cancer immunotherapy strategy. However, TCR gene transfer results in competition for surface expression and inappropriate pairing between the exogenous and endogenous TCR chains, resulting in suboptimal activity and potentially harmful unpredicted antigen specificities of the resultant TCRs. We designed zinc-finger nucleases (ZFNs) that promoted the disruption of endogenous TCR β- and α-chain genes. Lymphocytes treated with ZFNs lacked surface expression of CD3-TCR and expanded with the addition of interleukin-7 (IL-7) and IL-15. After lentiviral transfer of a TCR specific for the Wilms tumor 1 (WT1) antigen, these TCR-edited cells expressed the new TCR at high levels, were easily expanded to near purity and were superior at specific antigen recognition compared to donor-matched, unedited TCR-transferred cells. In contrast to unedited TCR-transferred cells, the TCR-edited lymphocytes did not mediate off-target reactivity while maintaining their anti-tumor activity in vivo, thus showing that complete editing of T cell specificity generates tumor-specific lymphocytes with improved biosafety profiles.


Figures

Figure 1
Figure 1. ZFN mediated disruption of TRBC genes in human T lymphocytes
a. Left: diagram of the human locus encoding for the TCR β chain; TRBV, variable region genes, TRBD, diversity region genes, TRBJ, junction region genes, TRBC, constant region genes. Right: the genomic DNA sequences in TRBC1 and TRBC2 bound by each TRBC-ZFN. b. Schematic representation of lentiviral vectors expressing the ZFN pair targeting the T cell receptor β chain (TRBC) genes and packaged by an integrase-defective system. SD and SA, splice donor and acceptor sites; Ψ encapsidation signal, including the 5’portion of the gag (GA) gene; RRE, Rev-responsive element; Wpre, woodchuck hepatitis virus post-transcription regulatory element. SFFV, spleen focus forming virus promoter. c. Down-regulation of cell surface CD3 expression measured by flow cytometry in Jurkat cells exposed to increasing concentrations of TRBC-ZFN IDLVs (measured by HIV Gag p24 equivalents). The percentage of CD3neg cells is indicated. UT, Untransduced cells. d. Level of targeted gene disruption measured by a mismatch-selective Cel1 endonuclease assay on DNA amplified from the cells shown in c, before (bulk) and after sorting for presence (+) or absence (−) of CD3 on the cell surface. The schematic on the right shows the expected size of the intact amplicon (upper wild type bands, denoted w/t, in the gel) and the Cel1 cleavage products of heteroduplexes carrying mismatches around the ZFN target site introduced by non-homologous end joining (NHEJ) (lower bands in the gel; note that the two cleavage products co-migrate at ~200 bp for TRBC2). Other bands are non-specific amplification products. The calculated level of targeted gene disruption in TRBC1 and TRBC2 is shown on bottom. e. Down-regulation of cell surface CD3 expression and level of targeted gene disruption (f) in primary human lymphocytes exposed to increasing concentrations of TRBC-ZFN IDLVs stimulated with baCD3/CD28, and cultured with 5ng ml−1 IL-7 and IL-15. Legend as in c, d. Other bands in the TRBC2 gel derive from a single nucleotide polymorphism in that locus. g. The TRBC1 and TRBC2 DNA in ZFN-treated lymphocytes was amplified, cloned and sequenced to confirm ZFN cleavage. Sequence alignment revealed several nucleotide insertions and/or deletions (indels) encompassing the ZFN target region. Left column indicates the number of clones retrieved while the right column indicates the number of nucleotides deleted or inserted.
Figure 2
Figure 2. Expansion and purification of CD3neg primary T lymphocytes
a. Left: Expansion of CD3neg cells generated by exposure to increasing concentrations of TRBC-ZFN IDLVs in the presence of 5ng ml−1 IL-7 and IL-15. CD3pos, untransduced (UT) lymphocytes from the same donors are shown as controls. Right: Stability of CD3neg phenotype in culture. b. Left: Resistance of CD3neg cells to polyclonal TCR-mediated stimulation. Lymphocytes were activated with PHA 2 μg ml−1 20 days after exposure to TRBC-ZFN and cultured with 5ng ml−1 IL-7, IL-15 and 300IU ml−1 IL-2. CD3pos and CD3neg cells were quantified by cytometry every 4-6 days and average + SD are shown (n=2, *, p<0.05). Right: average + SD of percentage of CD3neg lymphocytes before and after PHA stimulation. c. Representative plots (upper panel) and average histograms (lower panels) showing the expression of CD62L, CD28, CD27 and IL-7Rα in CD3neg and CD3pos gated cells. To measure IL-7Rα expression, cells were washed and cultured in the absence of cytokines for 18 hours before staining with fluorochrome-conjugated antibodies. d. Sorting of CD3neg cells to near homogeneity and expansion of sorted CD3neg cells (e) compared to that of CD3pos cells and untransduced (UT) lymphocytes in the presence of IL-7 and IL-15.
Figure 3
Figure 3. TCR β-gene editing results in high avidity tumor-specific T lymphocytes
CD3neg lymphocytes, obtained by treatment with TRBC-ZFN-IDLVs followed by cell sorting, and untreated lymphocytes (UT) were transduced with WT1-TCR LV (MOI 65), expanded and assayed for WT1-TCR expression and activity. a. Schematics of bidirectional LV coordinately expressing the two WT1-specific TCR chains. A PGK promoter, flanked upstream and in opposite orientation by a minimal core promoter (derived from the human cytomegalovirus, minCMV), drive transcription of both codon-optimized cysteine-modified TCR chains. Other legends as in 1b. b. Representative dot plots showing surface expression of WT1-specific TCR β chain (Vβ21) and CD3 at each step of the experiment. Percentage of events measured in each quadrant are shown. The timeline is shown on the bottom. c. Vβ21 expression (upper histograms), and WT1126-134 pentamer binding (lower histograms) are shown in representative TCR-β-edited and unedited CD8pos T cells after WT1-TCR LV gene transfer, and in control untransduced lymphocytes treated with the same culture conditions. Vector copy number (VCN) measured by quantitative PCR in TCR-transferred and TCR-β-edited cells is shown. d. Stability of surface expression of Vβ21 TCR chain. Vβ21 relative fluorescence intensity (RFI) is calculated as the ratio of the mean fluorescence intensity (MFI) of Vβ21 measured in genetically modified lymphocytes to the MFI of Vβ21 in naturally expressing T cells. e. Cytotoxic assay with TCR-β-edited and TCR-transferred cells. Functional activity is measured by a 51Chromium release assay for lysis of labeled T2 cells pulsed with increasing concentrations of the WT1126-134 HLA-A2 restricted peptide, or with the irrelevant CMV-derived pp65495-503 HLA-A2 restricted peptide (10 μM) as negative control, at an Effector/Target (E/T) ratio of 12. Results are represented as average + SD of percentage of lysis (***, p<0.001, n=6). f. Mispairing of cysteine-modified TCR β chain and endogenous α chain. CD3neg cells sorted from TRBC-disrupted lymphocytes (right panels) and unedited cells (left panels) were transduced by a bidirectional LV encoding the β chain of the WT1-specific TCR and the truncated low affinity NGF receptor (ΔLNGFR) cDNA under the control of the bidirectional PGK promoter. Transduction efficiency was assessed as percentage of ΔLNGFRpos lymphocytes (histograms). Vβ21 expression was measured on ΔLNGFRpos cells (plots). The MFI of Vβ21 is shown. Results of 1 representative of six experiments are shown.
Figure 4
Figure 4. Full TCR a/β-gene editing results in high avidity tumor-specific lymphocytes with sharply reduced alloreactivity
a. Left: diagram of the human locus encoding for the TCR α chain; TRAV, variable region genes; TRAJ, junction region genes; TRAC, constant region gene. Right: the genomic DNA sequences in TRAC bound by each TRAC-ZFN. b. Schematic, timeline and representative flow cytometry analysis at each step of a protocol optimized for full TCR gene editing. Activated T lymphocytes were treated with TRAC-ZFN-AdV (MOI 103), and CD3neg lymphocytes sorted and transduced with WT1-TCR-α LV (MOI 65). After one cycle of polyclonal stimulation, α-edited lymphocytes were treated with TRBC-ZFN-AdV (MOI 104) and CD3neg cells sorted and transduced with WT1-TCR-β LV (MOI 100). The full TCR-edited lymphocytes were then expanded for functional analysis. Surface expression of CD3 and Vβ21 is shown, with the percentage of events measured in each quadrant. c. Vβ21 TCR expression (upper histograms) and WT1126-134 pentamer binding (lower histograms) are shown in CD8pos T cells with TCR α/β chains disrupted and transduced with the WT1-TCR chains (TCR-α/β-edited), unedited WT1-TCR LV transduced cells (TCR-transferred), and untransduced lymphocytes treated with the same culture conditions. Vβ21 RFI and WT1126-134 pentamer MFI are indicated on the right for cells gated on Vβ21 and CD8. d. TCR-transferred and TCR-α/β-edited T lymphocytes were plated at 0.2 × 10⁵ ml−1 and activated with anti-CD3 antibody (30 ng ml−1), irradiated allogeneic PBMCs (1×10⁶ cells ml−1) and irradiated allogeneic EBV cell lines (0.2 × 10⁶ ml−1), and IL-2 (300 IU ml−1). IL-2 was replaced every 3-4 days, and cells were counted by trypan blue exclusion. Every step of activation is indicated by an arrow. e-g. Functional activity of genetically modified lymphocytes. Three weeks after polyclonal stimulation TCR-α/β-edited, TCR-β-edited, TCR-transferred (sorted for high expression of Vβ21) and untransduced lymphocytes were tested in γIFN ELISpot against: (e) T2 cells pulsed with increasing concentrations of the WT1126-134 HLA-A2 restricted peptide, or with the irrelevant CMV-derived pp65495-503 HLA-A2 restricted peptide (10 μM) as negative control; (f) irradiated allogeneic PBMC. All assays were performed at a responder/stimulator ratio of 1. Specific spots are shown on the y axis as spots produced in presence of stimulators minus spots produced by effectors alone. (g) TCR-α/β-edited and Vβ21-sorted TCR-transferred cells were challenged with HLA-A2pos and HLA-A2neg AML primary blasts, harvested from leukemic patients, in a cytotoxic assay. *, p<0.05, **,p<0.01, ***, p<0.001.
Figure 5
Figure 5. TCR a/β-gene edited lymphocytes inhibit leukemia development without inducing GvHD in immunodeficient mice
NSG mice were sub-lethally irradiated (175 cGy) prior to the i.v. transfer of PBS (n=5), 10×106 PBMC (n=6), 10×106 TCR-transferred cells sorted for Vβ21 expression (n=5), and 10×106 matched TCR-a/β-edited lymphocytes (n=7). After infusion, mice were followed for survival without severe GvHD (a) and weight loss (b). Mice were monitored and scored for clinical signs of GvHD (c) according to the following criteria: weight loss (0-2), hunching (0-2), activity (0-2), fur texture (0-2), and skin integrity (0-2). Human chimerism was assessed in peripheral blood and calculated as [huCD45+/(huCD45+ + mCD45+)] × 100 at days 1, 4 and 7 after infusion (d). Expression of WT1-specific TCR was quantified before infusion and at sacrifice on gated human cells (hCD45+) and expressed as percentage of Vβ21pos cells (lines, e) and Vβ21 RFI (columns, e), calculated as the ratio of the Vβ21 MFI measured on genetically modified lymphocytes to the MFI of Vβ21 in naturally expressing T cells. TCR-transferred cells, gray. TCR-α/β-edited cells, black. f. NSG mice were sub-lethally irradiated (175 cGy) prior to the i.v. transfer of 5-10 ×106 AML blasts from HLA-A2pos patients, and PBS (n=11), 10×106 untransduced lymphocytes (UT, n=8), 10×106 TCR-transferred cells sorted for Vβ21 expression (n=10), and 10×106 TCR-α/β-edited lymphocytes from the same donors (n=8). After infusion, mice were followed for event free survival (survival in the absence of GvHD and/or leukemia). *, p<0.05, **, p<0.01, ***, p<0.001.

References

    1. Appelbaum FR. Haematopoietic cell transplantation as immunotherapy. Nature. 2001;411:385–389. - PubMed
    1. Dudley ME, et al. Adoptive cell therapy for patients with metastatic melanoma: evaluation of intensive myeloablative chemoradiation preparative regimens. J Clin Oncol. 2008;26:5233–5239. - PMC - PubMed
    1. Hunder NN, et al. Treatment of metastatic melanoma with autologous CD4+ T cells against NY-ESO-1. N Engl J Med. 2008;358:2698–2703. - PMC - PubMed
    1. Kessels HW, Wolkers MC, van den Boom MD, van der Valk MA, Schumacher TN. Immunotherapy through TCR gene transfer. Nature immunology. 2001;2:957–961. - PubMed
    1. Morgan RA, et al. Cancer regression in patients after transfer of genetically engineered lymphocytes. Science. 2006;314:126–129. - PMC - PubMed

Publication types

Substances