. 2012 Apr 1;19(5):478-84, S1.
doi: 10.1038/nsmb.2271.

p53-mediated heterochromatin reorganization regulates its cell fate decisions

Affiliations

p53-mediated heterochromatin reorganization regulates its cell fate decisions

Sathish Kumar Mungamuri et al. Nat Struct Mol Biol. .

Abstract

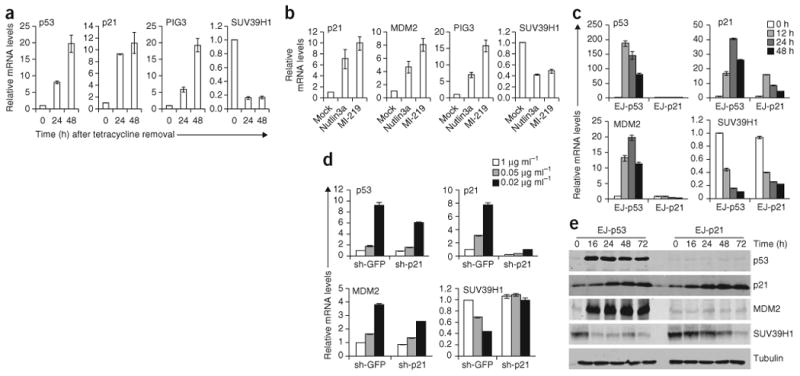
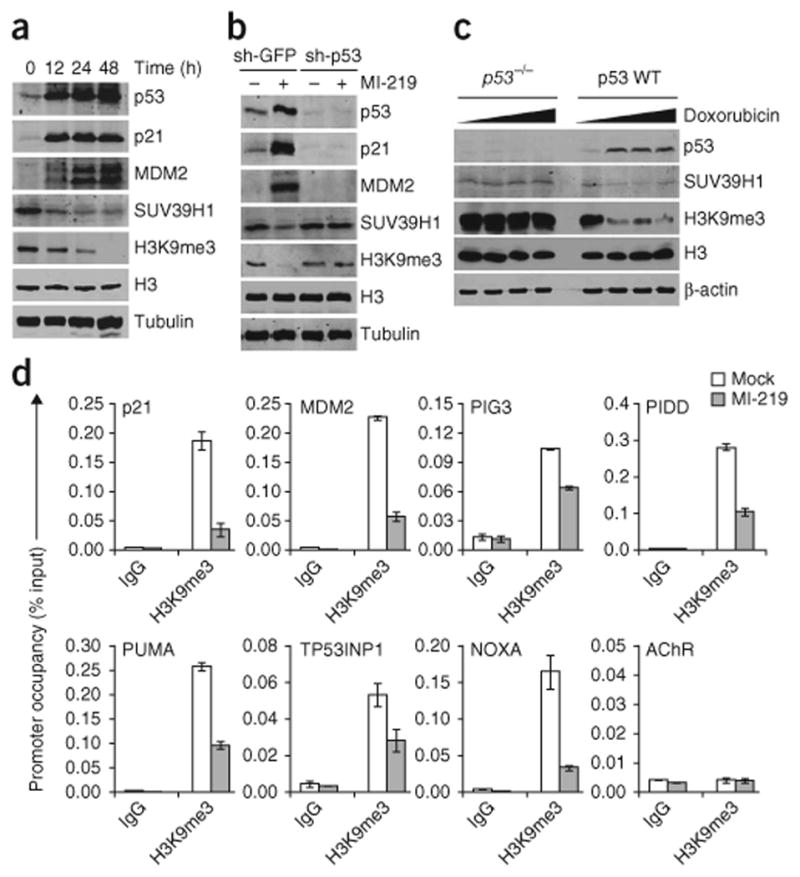
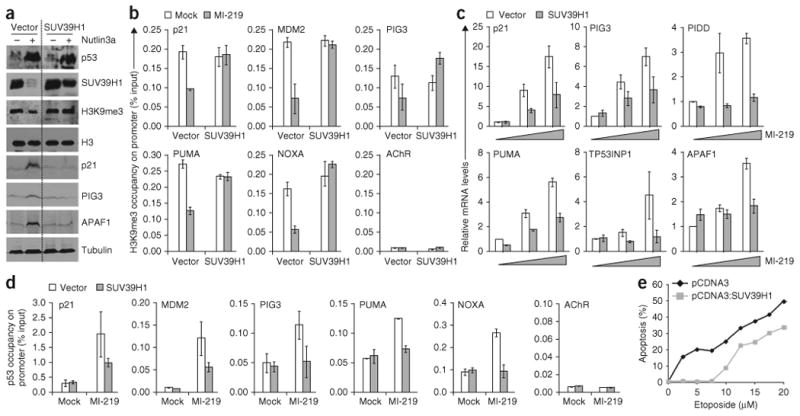
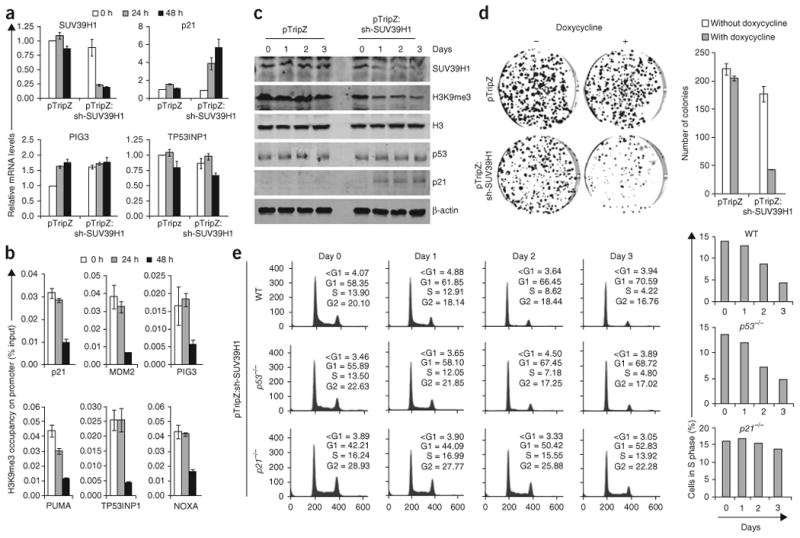
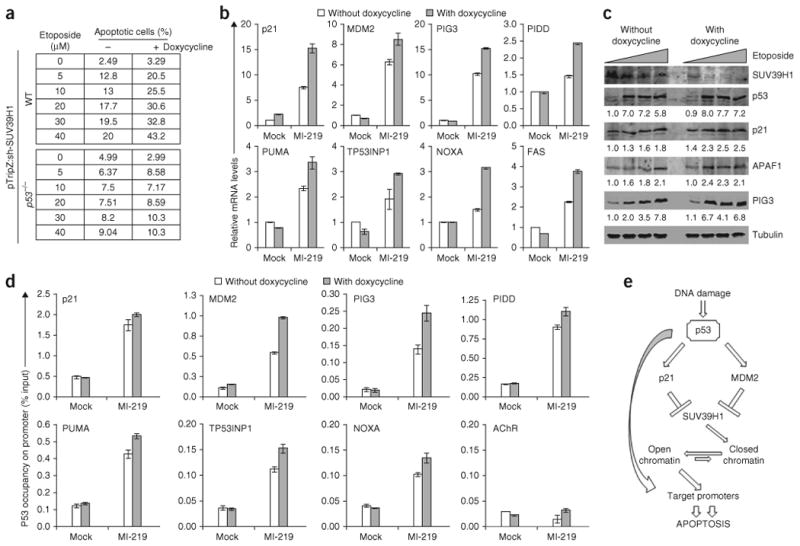
p53 is a major sensor of cellular stresses, and its activation influences cell fate decisions. We identified SUV39H1, a histone code 'writer' responsible for the histone H3 Lys9 trimethylation (H3K9me3) mark for 'closed' chromatin conformation, as a target of p53 repression. SUV39H1 downregulation was mediated transcriptionally by p21 and post-translationally by MDM2. The H3K9me3 repression mark was found to be associated with promoters of representative p53 target genes and was decreased upon p53 activation. Overexpression of SUV39H1 maintained higher levels of the H3K9me3 mark on these promoters and was associated with decreased p53 promoter occupancy and decreased transcriptional induction in response to p53. Conversely, SUV39H1 pre-silencing decreased H3K9me3 levels on these promoters and enhanced the p53 apoptotic response. These findings uncover a new layer of p53-mediated chromatin regulation through modulation of histone methylation at p53 target promoters.


Conflict of interest statement

Competing Financial Interests: The authors declare no competing financial interests.

Figures

Figure 1
Figure 1
p53 downregulates SUV39H1 expression. (a) Real-time quantitative PCR (qrtPCR) of EJ-p53 cells induced for p53 for the indicated time points. (b) qrtPCR of B5/589 cells treated with either Nutlin3a or MI-219. (c) qrtPCR of EJ-p53 and EJ-p21 cells induced for p53 or p21, respectively, for the indicated time points. (d) qrtPCR of EJ-p53 cells stably expressing either sh-GFP or sh-p21 and induced for different levels of p53 for 24 h at the indicated tetracycline concentrations. (e) Western blot analysis of indicated proteins in EJ-p53 and EJ-p21 cells induced for either p53 or p21, respectively, for the indicated time points. All error bars represent s.e.m. of representative experiments done in triplicate.
Figure 2
Figure 2
Induction of p53 abrogates the H3K9me3 heterochromatin mark. (a) Western blot analysis of EJ-p53 cells induced for p53 for the indicated time points by the complete removal of tetracycline from the medium. (b) Western blot analysis of B5/589 cells expressing either sh-GFP or sh-p53 and treated with MI-219. (c) Western blot analysis of HCT116 p53 WT and HCT116 p53−/− cells treated with 0, 0.05, 0.1 or 0.2 μg ml−1 of doxorubicin for 48 h. (d) ChIP analysis showing H3K9me3 occupancy on p53 target promoters in B5/589 cells treated with MI-219 for 24 h. The target sequences were detected by qrtPCR analysis of eluted DNA. The relative H3K9me3 occupancy over the input percentage is shown as a bar diagram. Acetylcholine receptor (AChR) is used as a negative control. All error bars represent s.e.m. of representative experiments done in triplicate.
Figure 3
Figure 3
Overexpression of SUV39H1 inhibits p53-dependent apoptosis. (a) Western blot analysis of B5/589 cells overexpressing SUV39H1 and treated with Nutlin3a. The dotted line in the figure divides the vector from SUV39H1 bands. The discontinuity in the bands of the first three westerns is due to deletion of irrelevant lanes in this gel. (b) ChIP analysis showing H3K9me3 occupancy on p53 target promoters in B5/589 cells overexpressing SUV39H1 and treated with MI-219 for 24 h. The target sequences were detected by qrtPCR analysis of eluted DNA. The relative H3K9me3 occupancy over the percent input is shown as a bar diagram. Acetylcholine receptor (AChR) is used as a negative control. (c) qrtPCR of B5/589 cells overexpressing SUV39H1 and treated with 0 μM, 5 μM or 10 μM of MI-219. (d) ChIP analysis showing p53 occupancy on its target promoters in B5/589 cells overexpressing SUV39H1 and treated with MI-219 for 24 h. The target sequences were detected by qrtPCR analysis of eluted DNA. The relative p53 promoter occupancy over the percent input is shown as a bar diagram. (e) Propidium iodide staining of HCT116 cells overexpressing SUV39H1 and treated with increasing doses of etoposide. The percentage of cells undergoing apoptosis (less than 2N content of DNA) is shown as a line diagram. All error bars represent s.e.m. of representative experiments done in triplicate.
Figure 4
Figure 4
Silencing of SUV39H1 causes p21-dependent, but p53-independent, cell cycle arrest. (a) qrtPCR of HCT116 WT cells stably transduced with inducible sh-SUV39H1 and cultured in the presence of doxycycline for the indicated time points. (b) ChIP analysis showing H3K9me3 occupancy on p53 target promoters in HCT116 WT cells stably transduced with inducible sh-SUV39H1 and cultured in the presence of doxycycline for the indicated time points. The target sequences were detected by qrtPCR analysis of eluted DNA. The relative H3K9me3 occupancy over the percent input is shown as a bar diagram. (c) Western blot analysis of HCT116 WT cells stably transduced with inducible sh-SUV39H1. Day 0, 1, 2 and 3 represent time after doxycycline addition into the medium. (d) Colony formation assay in HCT116 WT cells stably transduced with sh-SUV39H1. The cells were grown in the absence or presence of doxycycline. The colonies formed after 9 d were counted and are shown as a bar diagram. (e) Propidium iodide staining in HCT116 p53 WT, HCT116 p53−/− and HCT116 p21/ cells stably transduced with inducible sh-SUV39H1. Day 0, 1, 2 and 3 represent time after addition of doxycycline into the medium. A bar diagram for each cell line showing the percentage of cells in S phase is also shown on the right. All error bars represent s.e.m. of representative experiments done in triplicate.
Figure 5
Figure 5
Pre-silencing of SUV39H1 cooperates with chemotherapy-induced apoptosis in a p53-dependent manner. (a) Propidium iodide (PI) staining in HCT116 p53 WT and HCT116 p53−/− cells stably transduced with sh-SUV39H1. The cells were pre-silenced for SUV39H1 by growing cells in the presence of doxycycline for two days followed by treatment with increasing doses of etoposide. The percentage of cells showing less than a 2N content of DNA (apoptosis) in each condition is shown in the table (see Supplementary Fig. 7 for actual FACS graphs). (b) Real-time analysis of HCT116 WT cells stably transduced with inducible sh-SUV39H1 and cultured in the presence of doxycycline for two days followed by treatment with MI-219. (c) Western blot analysis of HCT116 WT cells stably transduced with sh-SUV39H1 and treated with 0 μM, 5 μM, 10 μM or 20 μM of etoposide for 48 h. The cells were either untreated or pre-treated with doxycycline for two days before treating with etoposide. (d) ChIP analysis in HCT116 WT cells stably expressing sh-SUV39H1 showing p53 occupancy on its target promoters. The cells were either untreated or treated with doxycycline for two days, followed by MI-219 treatment for 24 h. The target sequences were detected by qrtPCR analysis of eluted DNA. The relative p53 promoter occupancy over the percent input is shown in the form of bar diagram. Acetylcholine receptor (AChR) was used as a negative control. Error bars represent s.e.m. of representative experiments done in triplicate. (e) Schematic diagram illustrating the role of SUV39H1 in p53-induced apoptosis. SUV39H1 is the HMTase that adds the H3K9me3 repressive chromatin mark on p53 target promoters, which keeps them in a closed chromatin conformation. Activation of p53 downregulates SUV39H1 expression, which in turn leads to a decrease in the H3K9me3 epigenetic mark on p53 target promoters. This results in a more open chromatin conformation that allows a higher level of p53 recruitment, leading to increased transcription of target genes and resulting in enhanced apoptosis.

References

    1. Jenuwein T, Allis CD. Translating the histone code. Science. 2001;293:1074–1080. - PubMed
    1. Mandinova A, Lee SW. The p53 pathway as a target in cancer therapeutics: obstacles and promise. Sci Transl Med. 2011;3:64rv1. - PMC - PubMed
    1. Vousden KH, Prives C. Blinded by the light: the growing complexity of p53. Cell. 2009;137:413–431. - PubMed
    1. Vazquez A, Bond EE, Levine AJ, Bond GL. The genetics of the p53 pathway, apoptosis and cancer therapy. Nat Rev Drug Discov. 2008;7:979–987. - PubMed
    1. Liu L, et al. p53 sites acetylated in vitro by PCAF and p300 are acetylated in vivo in response to DNA damage. Mol Cell Biol. 1999;19:1202–1209. - PMC - PubMed

Publication types

MeSH terms