. 2012 Jul;40(13):6319-37.
doi: 10.1093/nar/gks294. Epub 2012 Mar 30.

Delivery of chemo-sensitizing siRNAs to HER2+-breast cancer cells using RNA aptamers

Affiliations

Delivery of chemo-sensitizing siRNAs to HER2+-breast cancer cells using RNA aptamers

Kristina W Thiel et al. Nucleic Acids Res. 2012 Jul.

Abstract

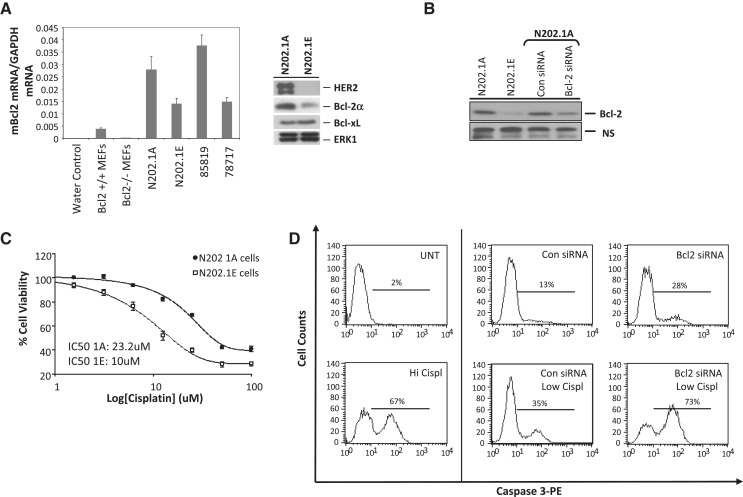
Human epidermal growth factor receptor 2 (HER2) expression in breast cancer is associated with an aggressive phenotype and poor prognosis, making it an appealing therapeutic target. Trastuzumab, an HER2 antibody-based inhibitor, is currently the leading targeted treatment for HER2(+)-breast cancers. Unfortunately, many patients inevitably develop resistance to the therapy, highlighting the need for alternative targeted therapeutic options. In this study, we used a novel, cell-based selection approach for isolating 'cell-type specific', 'cell-internalizing RNA ligands (aptamers)' capable of delivering therapeutic small interfering RNAs (siRNAs) to HER2-expressing breast cancer cells. RNA aptamers with the greatest specificity and internalization potential were covalently linked to siRNAs targeting the anti-apoptotic gene, Bcl-2. We demonstrate that, when applied to cells, the HER2 aptamer-Bcl-2 siRNA conjugates selectively internalize into HER2(+)-cells and silence Bcl-2 gene expression. Importantly, Bcl-2 silencing sensitizes these cells to chemotherapy (cisplatin) suggesting a potential new therapeutic approach for treating breast cancers with HER2(+)-status. In summary, we describe a novel cell-based selection methodology that enables the identification of cell-internalizing RNA aptamers for targeting therapeutic siRNAs to HER2-expressing breast cancer cells. The future refinement of this technology may promote the widespread use of RNA-based reagents for targeted therapeutic applications.


Figures

Figure 1.
Figure 1.
Cell-Internalization SELEX (systematic evolution of ligands by exponential enrichment). (A) Schematic of the methodology used to isolate aptamers that specifically internalize into HER2-expressing cells. (B) Equal amount of lysates from N202.1A(HER2+) and N202.1E(HER2) mouse mammary carcinoma cells were blotted for HER2 protein (left panel). ERK1 was used as a loading control for total protein. Cell surface expression of HER2 on N202.1A(HER2+) cells was confirmed by flow cytometry using non-permeabilized cells stained with either isotype control antibody (gray) or HER2 antibody conjugated to FITC (blue: N202.1E; green: N202.1A) (right panel). (C) Nine rounds of cell-internalization SELEX were performed to enrich for RNA aptamers that internalize into N202.1A(HER2+) cells (target cells). Non-specific aptamers were removed by pre-clearing against N202.1E(HER2) cells (non-target cells). Progression of the selection was monitored using quantitative RT-PCR (qRT-PCR) and normalizing to an internal RNA reference control for the PCR. (D) Aptamer pools from rounds 0, 2, 4, 6, 8 and 9 were sequenced by 454 sequencing. Enrichment at each round was determined by the indicated formula (U = unique; T = total).
Figure 2.
Figure 2.
Internalization of single aptamers into HER2+-cells. (A) Dendrogram of sequence families with representative RNA aptamers and consensus sequence within each family. The consensus sequence of each family was determined and plotted using the distribution of nucleotides at each position (upper case >75%, lower case <75%, lower case/lower case <50%, gap 0%). The distribution (% of total) of sequence families within each round is shown on the right (circles). (B) Consensus sequences for each family were used to generate predicted secondary structures using RNAStructure algorithm. Interchangeable nucleotides in the consensus sequences for families A, C and E are highlighted in red. These nucleotides do not change the overall predicted secondary structure. The consensus sequence for family B generated three distinct predicted secondary structures. Single aptamers were evaluated for internalization into N202.1E(HER2) and N202.1A(HER2+) cells (C) and 78717(HER2) and 85819(HER2+) mammary carcinoma cells (D) using qRT-PCR as in Figure 1C. (E) Internalization of fluorescently labeled RNA aptamers into N202.1E(HER2) and N202.1A(HER2+) cells was measured by flow cytometry. (F) Confirmation of internalization of fluorescently labeled RNA aptamers (E1 and C1) into N202.1A(HER2+) cells using microscopy. A scrambled, non-internalizing aptamer (Scr) was used as a negative control in these experiments. Florescence images were overlaid with DAPI and P/C (phase contrast) channels. Arrows indicate perinuclear localization of RNA aptamers.
Figure 2.
Figure 2.
Internalization of single aptamers into HER2+-cells. (A) Dendrogram of sequence families with representative RNA aptamers and consensus sequence within each family. The consensus sequence of each family was determined and plotted using the distribution of nucleotides at each position (upper case >75%, lower case <75%, lower case/lower case <50%, gap 0%). The distribution (% of total) of sequence families within each round is shown on the right (circles). (B) Consensus sequences for each family were used to generate predicted secondary structures using RNAStructure algorithm. Interchangeable nucleotides in the consensus sequences for families A, C and E are highlighted in red. These nucleotides do not change the overall predicted secondary structure. The consensus sequence for family B generated three distinct predicted secondary structures. Single aptamers were evaluated for internalization into N202.1E(HER2) and N202.1A(HER2+) cells (C) and 78717(HER2) and 85819(HER2+) mammary carcinoma cells (D) using qRT-PCR as in Figure 1C. (E) Internalization of fluorescently labeled RNA aptamers into N202.1E(HER2) and N202.1A(HER2+) cells was measured by flow cytometry. (F) Confirmation of internalization of fluorescently labeled RNA aptamers (E1 and C1) into N202.1A(HER2+) cells using microscopy. A scrambled, non-internalizing aptamer (Scr) was used as a negative control in these experiments. Florescence images were overlaid with DAPI and P/C (phase contrast) channels. Arrows indicate perinuclear localization of RNA aptamers.
Figure 3.
Figure 3.
Affinity and specificity analysis of aptamer binding to recombinant HER2 using Surface Plasmon Resonance (SPR). (A) High-affinity interaction between immobilized aptamers (E1, B1 and C1) and rHer2 recombinant protein. Four different rHer2 protein concentrations were analyzed (5–40 nM) and the KD was reported for each aptamer. The aptamer binding profiles were fitted using Langmuir fitting model (with mass transfer), as determined by BIA evaluation 4.1 software, black lines. (B) Evaluation of the rHer2 protein specificity using three non-specific targets at 40 nM concentration each (b-hHer2; c-hEphA2 and d-BSA), over the immobilized aptamers.
Figure 4.
Figure 4.
Characterization of Bcl-2 expression in HER2+-breast cancer cells. (A) Bcl-2 overexpression at the mRNA level (left panel) was measured in HER2+- (wild-type MEFs, N202.1A, 85819) relative to HER2- (Bcl-2−/− MEFs, N202.1E, 78717) cells using qRT-PCR. Values for Bcl-2 mRNA were normalized to GAPDH mRNA for each sample. Bcl-2 protein expression levels (right panel), as assessed by immunoblot analysis, were elevated in N202.1A(HER2+) compared to N202.1E(HER2) cells. The protein expression levels of the related family member Bcl-xL were unchanged in the two cell types. The ERK expression level was used as the control of equal protein loading. (B) Western-blot analysis of Bcl-2 protein in N202.1A cells treated with Bcl-2-siRNAs or control non-targeting siRNAs after the liposome-mediated transfection. (C) Viability of N202.1A and N202.1E cells in the presence of increasing amounts of cisplatin. (D) Bcl-2 siRNA sensitizes N202.1A(HER2+) cells to cisplatin, resulting in apoptosis (as measured by activation of active cleaved caspase 3) at low cisplatin concentrations (20 µM). The percent of apoptotic cells was determined by flow cytometry analysis of caspase-3-PE stained cells. High dose cisplatin (80 µM).
Figure 5.
Figure 5.
Chimera-mediated death of HER2+-mammary carcinoma cells. (A) Predicted secondary structures of the HER2 aptamers-Bcl-2 siRNA chimeras using RNAStructure. Red nucleotides indicate the Bcl-2 siRNA guide strand sequence. Chimeras were generated by annealing the Bcl-2 guide strand to the complementary passenger strand sequence covalently linked to the 3′-end of each aptamer. (B) Cell-type specific internalization of the aptamer-siRNA chimeras was compared to that of the aptamers alone and analyzed by qRT-PCR as in Figure 1C. (C) Internalization of chimeras in N202.1A(HER2+) cells versus normal mouse mammary carcinoma cells (NMuMG) (B). (D) Silencing of Bcl-2 at the mRNA level was determined by qRT-PCR after incubation of N202.1A(HER2+) cells with chimeras for 38 h (top panel) or 96 h (bottom panel). Bcl-2 mRNA levels were normalized to GAPDH mRNA levels for each sample. (E) 5′-Rapid amplification of cDNA ends (5′-RACE) PCR analysis to assess siRNA mediated cleavage of Bcl2 mRNA in cells treated with the various HER2-Bcl2 chimeras (A1-Bcl2, B1-Bcl2, C3-Bcl2, D1-Bcl2, E1-Bcl2). A non-internalizing chimera (SCR1-Bcl2) was used as a control in these assays. (F) N202.1A(HER2+) cells were treated with either aptamer-Bcl-2 siRNA chimeras (Bcl2-chimeras; top panels) or aptamer-control siRNA chimeras (Con-chimeras; bottom panels) for 72 h, then with media containing chimeras (solid gray) and low-dose cisplatin (20 µM) (red line) for an additional 24 h. Following cisplatin treatment, cells were stained with an antibody to active cleaved caspase-3 and processed by flow cytometry to assess % apoptosis.
Figure 5.
Figure 5.
Chimera-mediated death of HER2+-mammary carcinoma cells. (A) Predicted secondary structures of the HER2 aptamers-Bcl-2 siRNA chimeras using RNAStructure. Red nucleotides indicate the Bcl-2 siRNA guide strand sequence. Chimeras were generated by annealing the Bcl-2 guide strand to the complementary passenger strand sequence covalently linked to the 3′-end of each aptamer. (B) Cell-type specific internalization of the aptamer-siRNA chimeras was compared to that of the aptamers alone and analyzed by qRT-PCR as in Figure 1C. (C) Internalization of chimeras in N202.1A(HER2+) cells versus normal mouse mammary carcinoma cells (NMuMG) (B). (D) Silencing of Bcl-2 at the mRNA level was determined by qRT-PCR after incubation of N202.1A(HER2+) cells with chimeras for 38 h (top panel) or 96 h (bottom panel). Bcl-2 mRNA levels were normalized to GAPDH mRNA levels for each sample. (E) 5′-Rapid amplification of cDNA ends (5′-RACE) PCR analysis to assess siRNA mediated cleavage of Bcl2 mRNA in cells treated with the various HER2-Bcl2 chimeras (A1-Bcl2, B1-Bcl2, C3-Bcl2, D1-Bcl2, E1-Bcl2). A non-internalizing chimera (SCR1-Bcl2) was used as a control in these assays. (F) N202.1A(HER2+) cells were treated with either aptamer-Bcl-2 siRNA chimeras (Bcl2-chimeras; top panels) or aptamer-control siRNA chimeras (Con-chimeras; bottom panels) for 72 h, then with media containing chimeras (solid gray) and low-dose cisplatin (20 µM) (red line) for an additional 24 h. Following cisplatin treatment, cells were stained with an antibody to active cleaved caspase-3 and processed by flow cytometry to assess % apoptosis.

Similar articles

Cited by

References

    1. Jemal A, Center MM, DeSantis C, Ward EM. Global patterns of cancer incidence and mortality rates and trends. Cancer Epidemiol. Biomarkers Prev. 2010;19:1893–1907. - PubMed
    1. Jemal A, Siegel R, Xu J, Ward E. Cancer statistics, 2010. CA Cancer J. Clin. 2010;60:277–300. - PubMed
    1. Jemal A, Ward E, Thun M. Declining death rates reflect progress against cancer. PLoS One. 2010;5:e9584. - PMC - PubMed
    1. DeSantis C, Jemal A, Ward E, Thun MJ. Temporal trends in breast cancer mortality by state and race. Cancer Causes Control. 2008;19:537–545. - PubMed
    1. Moasser MM. Targeting the function of the HER2 oncogene in human cancer therapeutics. Oncogene. 2007;26:6577–6592. - PMC - PubMed

Publication types

MeSH terms