. 2012 Jul 15;125(Pt 14):3390-401.
doi: 10.1242/jcs.098962. Epub 2012 Mar 30.

The F-BAR domains from srGAP1, srGAP2 and srGAP3 regulate membrane deformation differently

Affiliations

The F-BAR domains from srGAP1, srGAP2 and srGAP3 regulate membrane deformation differently

Jaeda Coutinho-Budd et al. J Cell Sci. .

Abstract

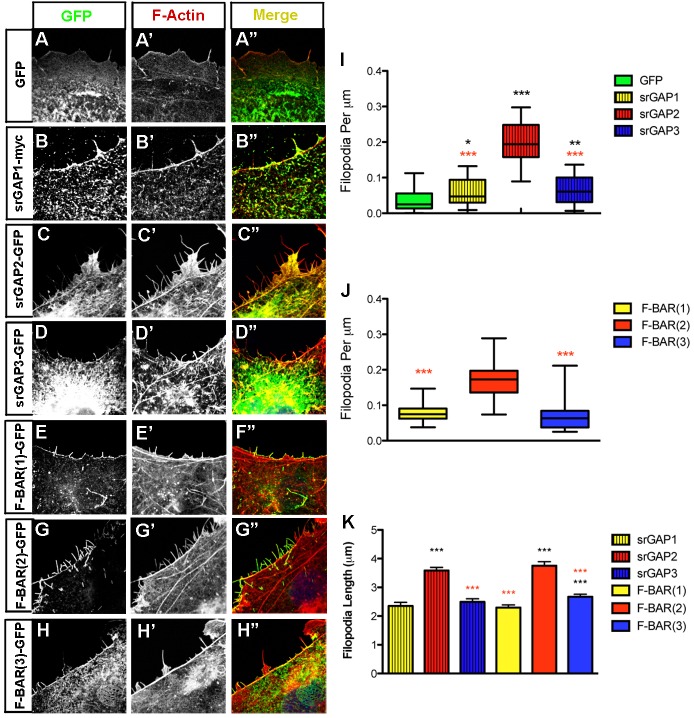
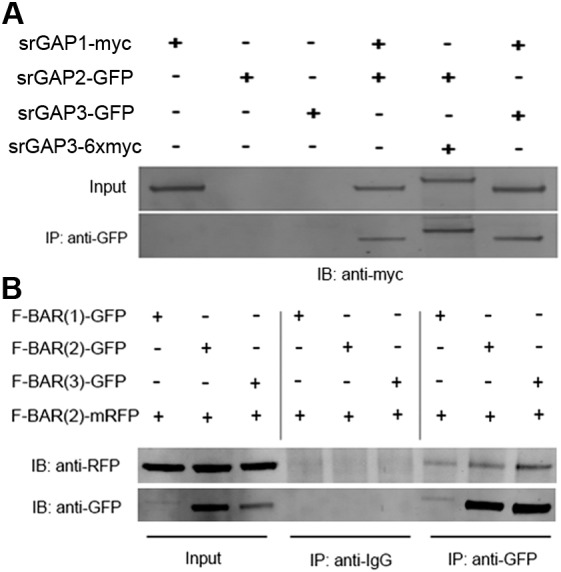
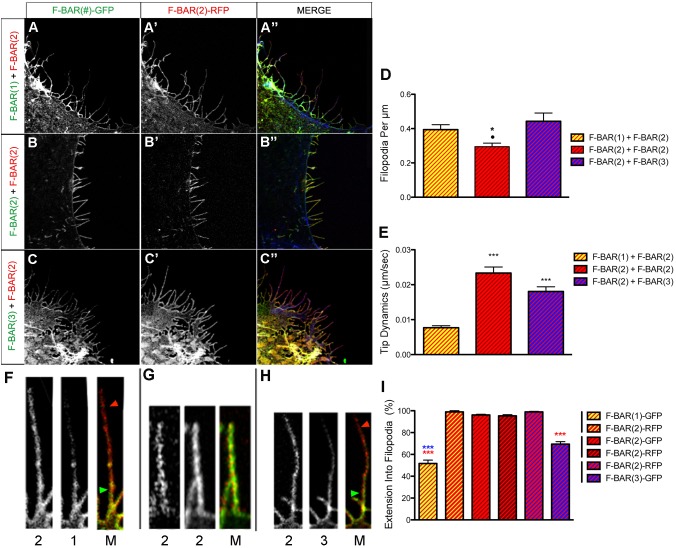
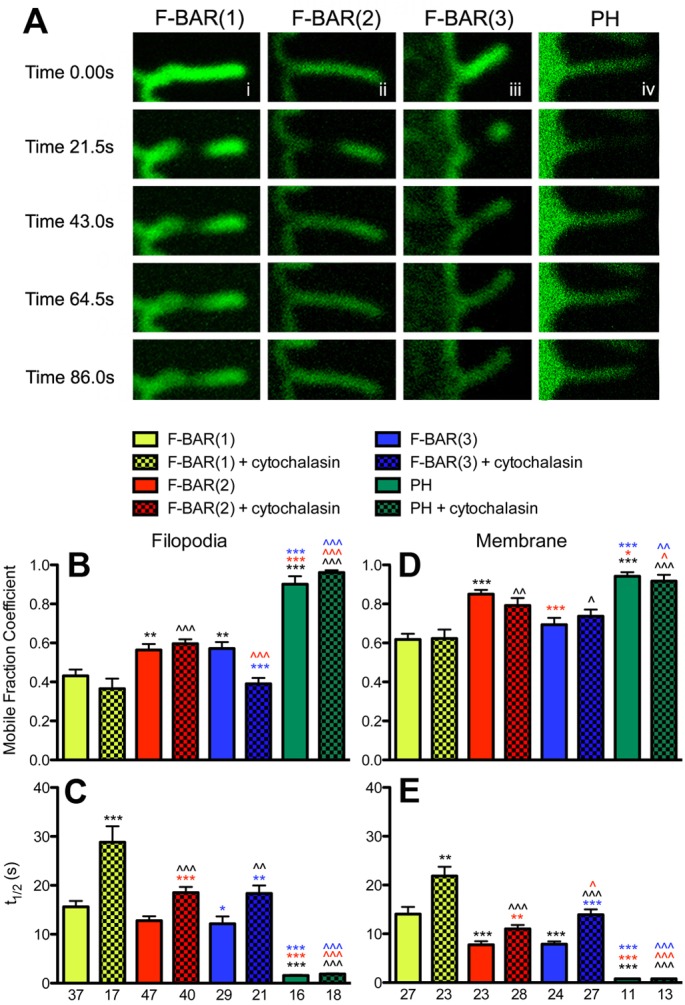
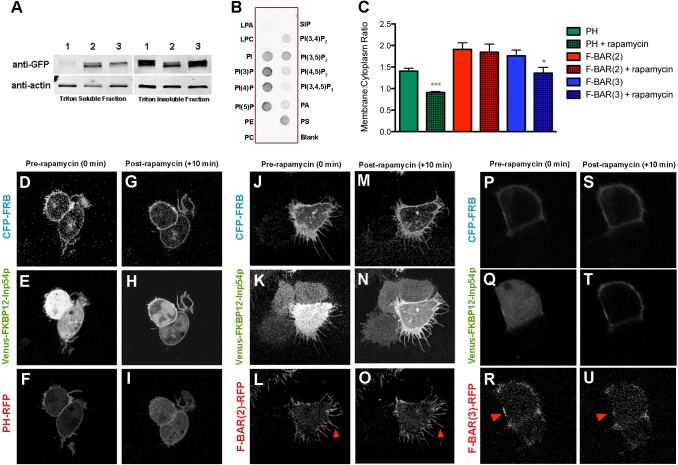
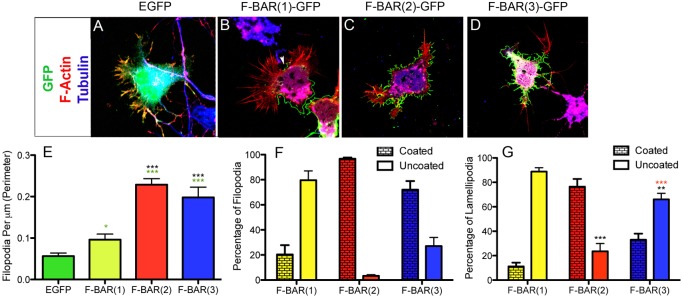
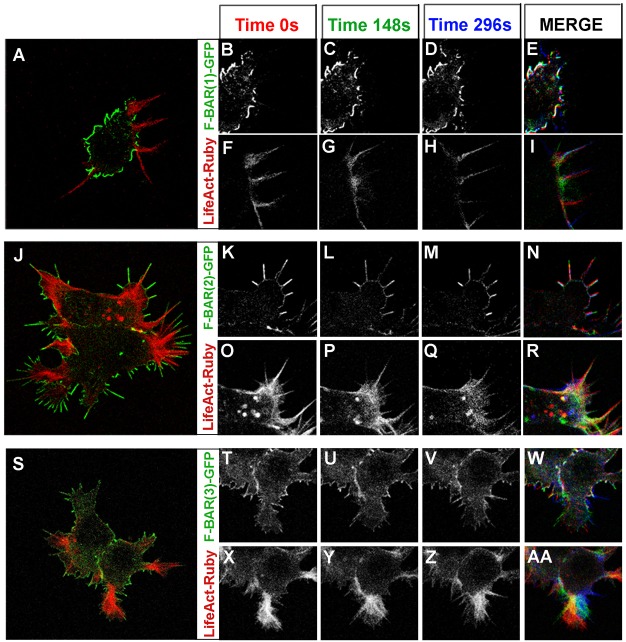
Coordination of membrane deformation and cytoskeletal dynamics lies at the heart of many biological processes critical for cell polarity, motility and morphogenesis. We have recently shown that Slit-Robo GTPase-activating protein 2 (srGAP2) regulates neuronal morphogenesis through the ability of its F-BAR domain to regulate membrane deformation and induce filopodia formation. Here, we demonstrate that the F-BAR domains of two closely related family members, srGAP1 and srGAP3 [designated F-BAR(1) and F-BAR(3), respectively] display significantly different membrane deformation properties in non-neuronal COS7 cells and in cortical neurons. F-BAR(3) induces filopodia in both cell types, though less potently than F-BAR(2), whereas F-BAR(1) prevents filopodia formation in cortical neurons and reduces plasma membrane dynamics. These three F-BAR domains can heterodimerize, and they act synergistically towards filopodia induction in COS7 cells. As measured by fluorescence recovery after photobleaching, F-BAR(2) displays faster molecular dynamics than F-BAR(3) and F-BAR(1) at the plasma membrane, which correlates well with its increased potency to induce filopodia. We also show that the molecular dynamic properties of F-BAR(2) at the membrane are partially dependent on F-Actin. Interestingly, acute phosphatidylinositol 4,5-bisphosphate [PtdIns(4,5)P(2)] depletion in cells does not interfere with plasma membrane localization of F-BAR(2), which is compatible with our result showing that F-BAR(2) binds to a broad range of negatively-charged phospholipids present at the plasma membrane, including phosphatidylserine (PtdSer). Overall, our results provide novel insights into the functional diversity of the membrane deformation properties of this subclass of F-BAR-domains required for cell morphogenesis.


Figures

Fig. 1.
Fig. 1.
srGAP2 induces significantly more filopodia than srGAP1 or srGAP3. (AH″) COS7 cells expressing EGFP only (A′–A″), EGFP-tagged full-length srGAP1 (B–B″), srGAP2 (C–C″) or srGAP3 (D–D″), or their respective F-BAR domains (E–H″) were counterstained with phalloidin for F-actin (A′–H′) in red. (I–J) Quantification of the effects described in A–H″ (n>25 cells). (K) srGAP2 and its F-BAR domain [F-BAR(2)] induce significantly longer filopodia than full-length srGAP1, srGAP3, or their respective F-BAR domains (n>200 filopodia; P<0.0001). Quantifications were taken from at least three independent experiments and analyzed using a non-parametric Mann–Whitney test. *P<0.05 (0.0193), **P<0.01 (0.0068), ***P<0.001; black asterisks indicate comparison with EGFP and red asterisks indicate comparison with srGAP2–EGFP or F-BAR(2)–EGFP.
Fig. 2.
Fig. 2.
srGAP proteins interact through their F-BAR domains. (A) Combinations of EGFP- and myc-tagged full-length srGAP proteins were coexpressed in COS7 cells, immunoprecipiated (IP) with anti-GFP and immunoblotted (IB) with anti-myc antibodies. Single-transfected control lysates demonstrate the specificity of the rabbit anti-EGFP and mouse anti-myc antibodies. Every combination of the three srGAP proteins was able to co-immunoprecipitate. (B) EGFP-tagged F-BAR(1)–F-BAR(3) were coexpressed with mRFP-tagged F-BAR(2) in COS7 cells. Cells lysates were incubated and immunoprecipitated with either rabbit anti-IgG control antibody or rabbit anti-EGFP antibody, and immunoblotted for either rabbit anti-RFP antibody or mouse anti-GFP antibody. All three EGFP-tagged F-BAR domains co-immunoprecipitated with F-BAR(2)–mRFP.
Fig. 3.
Fig. 3.
Synergy between F-BAR domains towards filopodia induction. (AC″) Coexpression of F-BAR(1)–GFP and F-BAR(2)–mRFP (A–A″), F-BAR(2)–GFP and F-BAR(2)–mRFP (B–B″), and FBAR(2)–mRFP and F-BAR(3)–GFP (C–C″) in COS7 cells. (D) Quantification of filopodia density in F-BAR-transfected COS7 cells. Co-transfection of F-BAR(1)–GFP or F-BAR(3)–GFP with F-BAR(2)–mRFP do not differ in their filopodia densities; however, both combinations induce significantly higher filopodia densities than any single F-BAR alone [n>25 cells; * and • indicate P<0.005, with * depicting significance between F-BAR(1) and F-BAR(2), and • marking significance between F-BAR(2) and F-BAR(3)]. (E) Quantification of filopodial dynamics based on the path travelled by the filopodia tips (n>186 filopodia; ***P<0.0001). (F–I) Intrafilopodia expression of each F-BAR varies in co-transfected COS7 cells, whereas F-BAR(1)–GFP extinguishes before F-BAR(2)–RFP (F), F-BAR(2)–GFP and F-BAR(2)–RFP both extend to the filopodial tip (G), and F-BAR(2)–RFP extends beyond F-BAR(3)–GFP (H); quantified in (I). n = 50 for F-BAR(1) and F-BAR(2); n = 75 for F-BAR(2) and F-BAR(2); n = 83 for F-BAR(2) and F-BAR(3); ***P<0.0001, red asterisks indicate comparison with F-BAR(2), and blue asterisks indicate comparison with F-BAR(3). Quantifications were taken from at least three independent experiments and analyzed using a Mann–Whitney non-parametric test.
Fig. 4.
Fig. 4.
The three F-BAR domains of srGAP proteins differ in their subcellular molecular dynamics. (A) FRAP analysis of EGFP-tagged F-BAR(1) (i), F-BAR(2) (ii), F-BAR(3) (iii), and PH domain of PLCδ1 (iv) in filopodia protrusions. The same analyses were performed at the peripheral membrane of the cell. (BE) Quantification of the mobile fraction coefficient (B,D) and half-time of recovery (t1/2; C,E) in filopodial protrusions (B–C) and at the peripheral plasma membrane (D–E). Cells were either imaged as untreated controls, or treated with cytochalasin-D for depolymerization of the actin cytoskeleton. Significance compared to untreated controls are marked by asterisks (*), and significance to cytochalasin-treated samples is marked with a caret ( ˆ). Significance is color-coded with black for F-BAR(1), red for F-BAR(2) and blue for F-BAR(3). n for each condition is marked below the bottom graph for filopodial and membrane, and is the same for mobile fraction and t1/2 at each location. */ ˆP<0.05, **/ ˆˆP<0.005, ***/ ˆˆˆP<0.0005.
Fig. 5.
Fig. 5.
F-BAR(2) binds multiple negatively-charged phospholipids. (A) Western blot depicting F-BARs found in two separate fractions, a Triton-X-soluble and Triton-X-insoluble fraction. The level of F-BAR(1) expression is 32-fold higher in the Triton-X-insoluble fraction, whereas the level of F-BAR(2) is slightly reduced in this fraction (0.6-fold) and F-BAR(3) is more highly expressed in the insoluble fraction (7.4-fold). (B) Binding of F-BAR(2) to immobilized phospholipids on nitrocellulose membrane (PIP Strip, Molecular Probes). Membrane was incubated with recombinant F-BAR(2) (amino acids 1–480) and subsequently immunoblotted with an antibody to srGAP2. LPA, lysophosphatidic acid; LPC, lysophosphatidylcholine; PE, phosphatidylethanolamine; PC, phosphatidylcholine; SIP, sphingosine 1-phosphate; PA, phosphatidic acid; PS, phosphatidylserine. (C) Quantification of pixel intensity of membrane to cytoplasmic localization pre- and post-rapamycin treatment (n = 15–16). (DU) Representative images of HEK293 cells triple-transfected with CFP–FRB, Venus–FKBP12–Inp54p, and the RFP-PH domain of PLCδ1 (D–I), F-BAR(2)–RFP (J–O), or F-BAR(3)–RFP (P–U) both pre- (C–E, I–K, P–R) and post-rapamycin treatment (F–H, L–N, S–U). Asterisks denote the difference between ratios of the pre- and post-rapamycin membrane localization to cytoplasmic localization in the same condition. *P<0.05, ***P<0.001.
Fig. 6.
Fig. 6.
F-BAR domains of srGAP proteins differ in their ability to induce filopodia in cortical neurons. (AD) E15.5 cortical neurons expressing EGFP (A) or EGFP-tagged F-BAR(1) (B), F-BAR(2) (C), or F-BAR(3) (D) were cultured for 24 hours in vitro (hiv) after ex vivo electroporation, fixed and stained with the F-actin marker phalloidin (red). (E) Cells with any of the three F-BARs contain more filopodia than GFP alone, although F-BAR(2) and F-BAR(3) induce significantly more filopodia than F-BAR(1). (F,G) Quantifications of the percentage of plasma membrane in filopodia (F) or lamellipodia (G) that is coated or uncoated with F-BAR protein. Quantifications were performed on at least three independent cultures and analyzed using Mann-Whitney test (**P<0.01, ***P<0.001; n>20 neurons). Black asterisks illustrate comparison against F-BAR(1), whereas red asterisks indicate difference from F-BAR(2).
Fig. 7.
Fig. 7.
Real-time imaging of membrane and F-actin dynamics induced by F-BAR domains in cortical neurons. E15.5 cortical neurons expressing the F-actin probe LifeAct-mRFPruby (red) and GFP-tagged F-BAR(1) (AI), F-BAR(2) (JR), or F-BAR(3) (SAA) following ex vivo electroporation and 24 hours in dissociated culture. GFP and mRuby channels are shown separately for ease of visualization (supplementary material Movies 1–3). Images from time series taken at 0, 148 and 296 seconds are pseudocolored in red, green and blue, respectively. The white overlay in the merge panel indicates limited spatial dynamics throughout the movie. (A) Whole-cell image of a cortical neuron coexpressing F-BAR(1)–EGFP and LifeAct-mRFPruby. (B–I) F-BAR(1)-coated membrane shows little to no spatial dynamics (B–E); however, dynamic neuritic protrusions can be visualized with LifeAct-mRFPruby at sites of ‘breaks’ in F-BAR(1)–GFP coated plasma membrane (F–I). (J) Whole-cell image of F-BAR(2)–EGFP and LifeAct-mRFPruby co-expressing neuron. (K–R) F-BAR(2)-coated membrane displays rapid extension and retraction of filopodia protrusions (K–N), although F-actin dynamics are largely confined to the area within the F-BAR(2)-coated membrane (O–R). (S) Whole-cell image of a cortical neuron coexpressing F-BAR(3)–EGFP and LifeAct-mRFPruby. (T–AA) F-BAR(3)–GFP-coated membrane presents numerous sites of filopodia-like membrane dynamics.

References

    1. Bacon C., Endris V., Rappold G. (2009). Dynamic expression of the Slit-Robo GTPase activating protein genes during development of the murine nervous system. J. Comp. Neurol. 513, 224–236 10.1002/cne.21955 - DOI - PubMed
    1. Carlson B., Soderling S. H. (2009). Mechanisms of cellular protrusions branch out. Dev. Cell 17, 307–309 10.1016/j.devcel.2009.08.015 - DOI - PMC - PubMed
    1. Carlson B. R., Lloyd K. E., Kruszewski A., Kim I. H., Rodriguiz R. M., Heindel C., Faytell M., Dudek S. M., Wetsel W. C., Soderling S. H. (2011). WRP/srGAP3 facilitates the initiation of spine development by an inverse F-BAR domain, and its loss impairs long-term memory. J. Neurosci. 31, 2447–2460 10.1523/JNEUROSCI.4433-10.2011 - DOI - PMC - PubMed
    1. Corpet F. (1988). Multiple sequence alignment with hierarchical clustering. Nucleic Acids Res. 16, 10881–10890 10.1093/nar/16.22.10881 - DOI - PMC - PubMed
    1. Dent E. W., Kwiatkowski A. V., Mebane L. M., Philippar U., Barzik M., Rubinson D. A., Gupton S., Van Veen J. E., Furman C., Zhang J., et al. (2007). Filopodia are required for cortical neurite initiation. Nat. Cell Biol. 9, 1347–1359 10.1038/ncb1654 - DOI - PubMed

Publication types