Review
. 2012 Apr;6(2):182-95.
doi: 10.1016/j.molonc.2012.02.005. Epub 2012 Mar 10.

Molecular imaging for personalized cancer care

Affiliations
Review

Molecular imaging for personalized cancer care

Moritz F Kircher et al. Mol Oncol. 2012 Apr.

Erratum in

Abstract

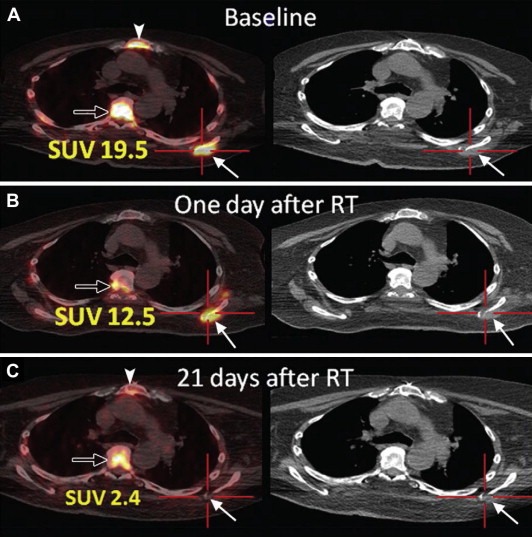
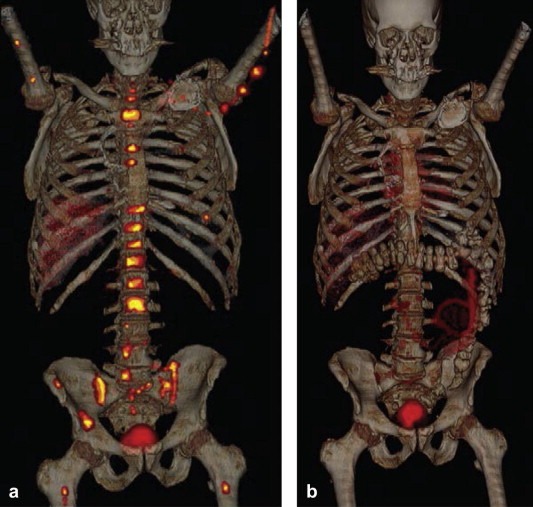
Molecular imaging is rapidly gaining recognition as a tool with the capacity to improve every facet of cancer care. Molecular imaging in oncology can be defined as in vivo characterization and measurement of the key biomolecules and molecularly based events that are fundamental to the malignant state. This article outlines the basic principles of molecular imaging as applied in oncology with both established and emerging techniques. It provides examples of the advantages that current molecular imaging techniques offer for improving clinical cancer care as well as drug development. It also discusses the importance of molecular imaging for the emerging field of theranostics and offers a vision of how molecular imaging may one day be integrated with other diagnostic techniques to dramatically increase the efficiency and effectiveness of cancer care.


Figures

Figure 1
Figure 1
Images in 79‐year‐old man with castrate‐resistant progressive metastatic prostate cancer (Gleason score, 9; prostate‐specific antigen level, 91 ng/mL) who underwent (a) technetium‐99 m bone scanning, (b) FDG‐PET/CT, and (c) FDHT‐PET/CT within the same week. Note the markedly larger number of bone and lymph node metastases demonstrated on c as compared to b or a. Two months after imaging, bone biopsy from the left ilium (the site of suspicious bone metastases demonstrated only on c) showed metastatic disease from primary prostate adenocarcinoma. (Reprinted from Hricak H. Oncologic imaging: a guiding hand of personalized cancer care. Radiology. 2011 Jun; 259(3):633–640).
Figure 2
Figure 2
Images in a 75‐year‐old man with progressive metastatic prostate cancer starting protocol therapy with abiraterone acetate, an enzyme inhibitor that reduces blood levels of testosterone. (a) CT component of FDG‐PET/CT, (b) fused FDG‐PET/CT, (c) CT component of FDHT‐PET/CT, and (d) fused FDHT‐PET/CT images show a sclerotic vertebral lesion (solid arrow) as well as right supraclavicular (open arrow) and retrotracheal (arrowhead) lymphadenopathy. Image b demonstrates increased glycolysis in the retrotracheal and right supraclavicular lymphadenopathy but no uptake in the vertebral bone lesion. Conversely, d demonstrates increased uptake in the vertebral bone lesion but no uptake in the retrotracheal and right supraclavicular lymphadenopathy. Biopsy of the retrotracheal node yielded a finding of “large cell” malignancy, favoring carcinoma, without further classification. This case demonstrates the phenomenon of discordant tumor biology between lesions. (Reprinted from Hricak H. Oncologic imaging: a guiding hand of personalized cancer care. Radiology. 2011 Jun; 259(3):633–640).
Figure 3
Figure 3
Imaging of tumor pH in vivo using hyperpolarized 13C‐labeled bicarbonate. (a) Transverse proton‐density weighted spin‐echo MR image (TR/TE 1500/30, flip angle, 90°) of a mouse with a subcutaneously implanted EL4 (murine lymphoma) tumor (outlined in red). (b) pH map of the same animal calculated from the ratio of the H13CO3 (c) and 13CO2 (d) voxel intensities in 13C chemical shift images acquired after intravenous injection of hyperpolarized H13CO3. The spatial distribution of H13CO3 (c) and 13CO2 (d) are displayed as voxel intensities relative to their respective maxima. Tumor margin in b, c and d outlined in white. (Reprinted, with permission, from reference (Gallagher et al., 2008)).
Figure 4
Figure 4
Axial T2‐weighted 1H image depicting the primary tumor and lymph node metastasis from a TRAMP mouse with a high‐grade primary tumor (A) and the overlay of an interpolated hyperpolarized 13C lactate image following the injection of 350 μL of hyperpolarized [1‐13C]pyruvate (B). After spatially zero filling and voxel shifting the 13C spectra to maximize the amount of tumor in the voxels, a subset of the spectral grid was selected (C) and displayed (D). The three‐dimensional MRSI was acquired with a nominal voxel resolution of 135 mm3 and zero filled to a resolution of 17 mm3. The spectra show substantially elevated lactate in the high‐grade primary tumor. In addition, the metabolite signal is significantly lower in the necrotic regions of the primary tumor. Lac, lactate; Ala, alanine; Pyr, pyruvate. (Reprinted, with permission, from reference (Albers et al., 2008).
Figure 5
Figure 5
Images from PET/CT performed by using 18 F L‐thymidine (FLT) in a 70‐year‐old man with widely metastatic squamous cell cancer of the oropharynx. Images were acquired, A, before, B, 1 day after, and, C, 21 days after single dose fraction (2400 cGy) radiation treatment (RT) of a metastatic lesion in the left scapula (solid arrows). There is resolution of uptake at the tumor site in the left scapula. Physiologic FLT uptake is seen in bone marrow of the thoracic spine (open arrow) and sternum (arrowhead). SUV = standardized uptake value. (Reprinted from Hricak H. Oncologic imaging: a guiding hand of personalized cancer care. Radiology. 2011 Jun; 259(3):633–640).
Figure 6
Figure 6
FDHT‐PET/CT images in a 69‐year‐old patient with castrate‐resistant metastatic prostate cancer (a) prior to and (b) 4 weeks after treatment with MDV3100, an androgen receptor antagonist. The images show a substantial reduction of FDHT accumulation in widespread bone metastases after 4 weeks of treatment, indicating successful targeting of the androgen receptor by MDV3100. (Reprinted from Hricak H. Oncologic imaging: a guiding hand of personalized cancer care. Radiology. 2011 Jun; 259(3):633–640).

References

    1. Albers, M.J. , Bok, R. , Chen, A.P. , 2008. Hyperpolarized 13C lactate, pyruvate, and alanine: noninvasive biomarkers for prostate cancer detection and grading. Cancer Res.. 68, (20) 8607–8615. - PMC - PubMed
    1. Arias-Mendoza, F. , Zakian, K. , Schwartz, A. , 2004. Methodological standardization for a multi-institutional in vivo trial of localized 31P MR spectroscopy in human cancer research. In vitro and normal volunteer studies. NMR Biomed.. 17, (6) 382–391. - PubMed
    1. Arias-Mendoza, F. , Payne, G.S. , Zakian, K.L. , 2006. In vivo 31P MR spectral patterns and reproducibility in cancer patients studied in a multi-institutional trial. NMR Biomed.. 19, (4) 504–512. - PubMed
    1. Bading, J.R. , Shields, A.F. , 2008. Imaging of cell proliferation: status and prospects. J. Nucl. Med.. 49, (Suppl. 2) 64S–80S. - PubMed
    1. Benezra, M. , Penate-Medina, O. , Zanzonico, P.B. , 2011. Multimodal silica nanoparticles are effective cancer-targeted probes in a model of human melanoma. J. Clin. Invest.. 121, (7) 2768–2780. - PMC - PubMed