

Benchmarking outcomes in the critically injured trauma patient and the effect of implementing standard operating procedures
- PMID: 22470077
- PMCID: PMC3327791
- DOI: 10.1097/SLA.0b013e31824f1ebc
Benchmarking outcomes in the critically injured trauma patient and the effect of implementing standard operating procedures
Abstract
Objective: To determine and compare outcomes with accepted benchmarks in trauma care at 7 academic level I trauma centers in which patients were treated on the basis of a series of standard operating procedures (SOPs).
Background: Injury remains the leading cause of death for those younger than 45 years. This study describes the baseline patient characteristics and well-defined outcomes of persons hospitalized in the United States for severe blunt trauma.
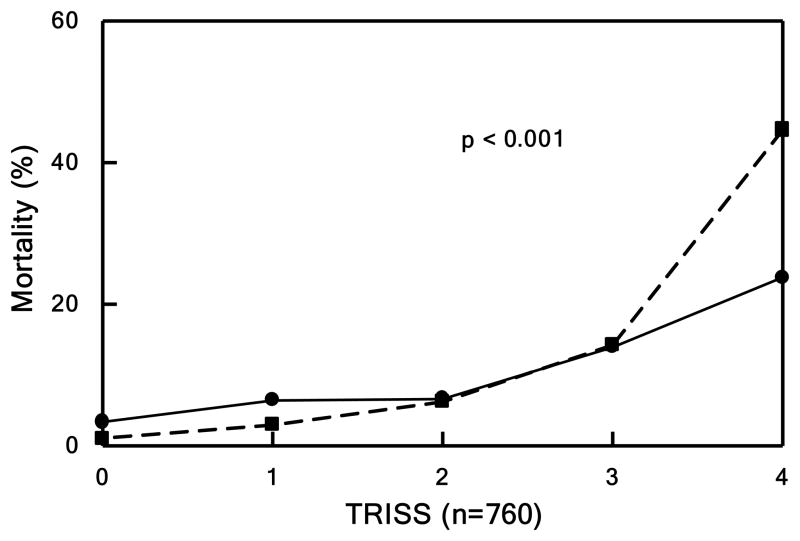
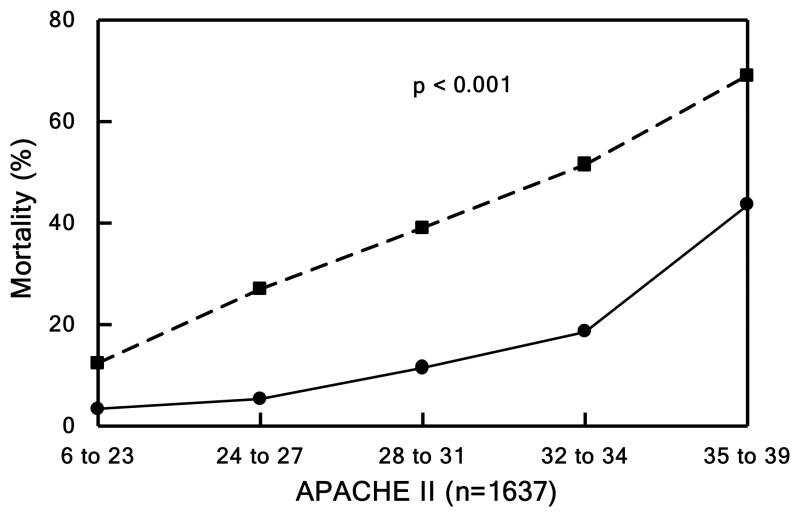
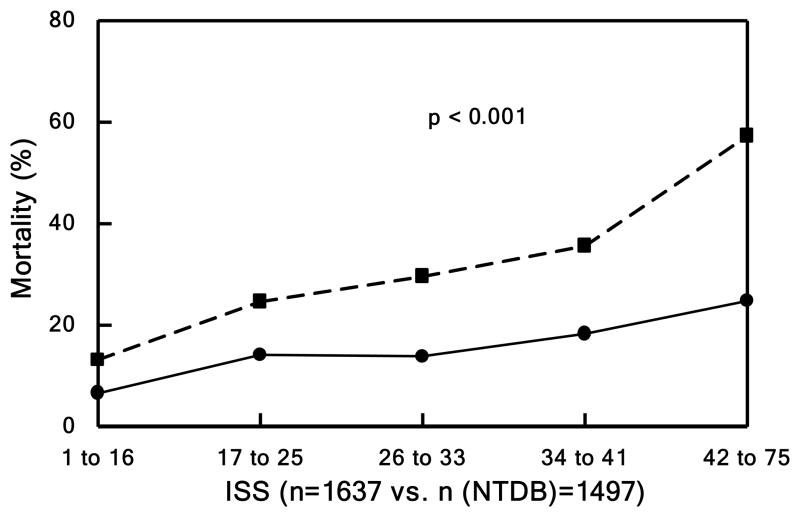
Methods: We followed 1637 trauma patients from 2003 to 2009 up to 28 hospital days using SOPs developed at the onset of the study. An extensive database on patient and injury characteristics, clinical treatment, and outcomes was created. These data were compared with existing trauma benchmarks.
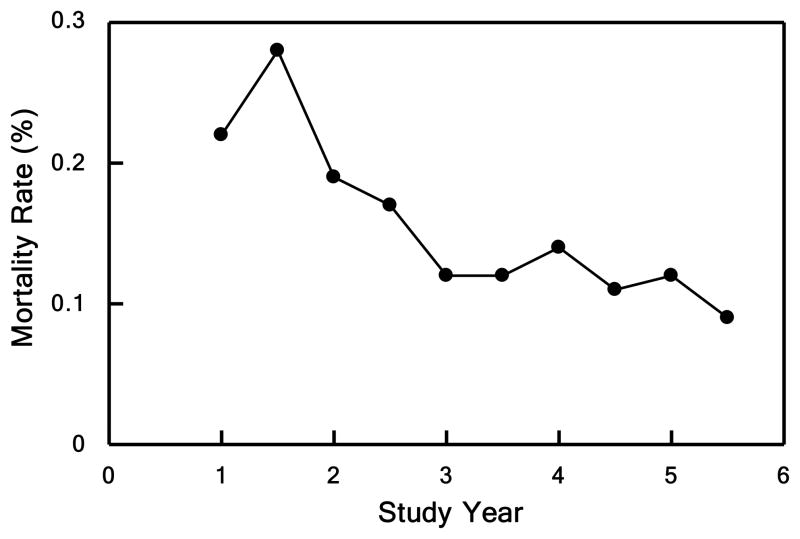
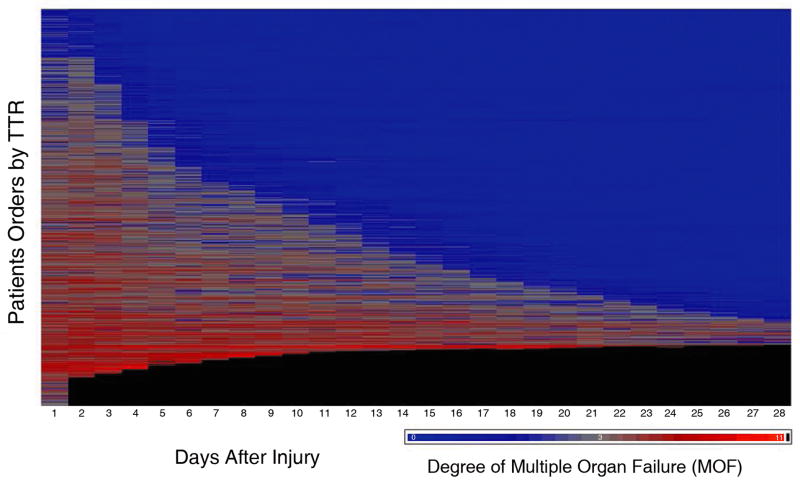
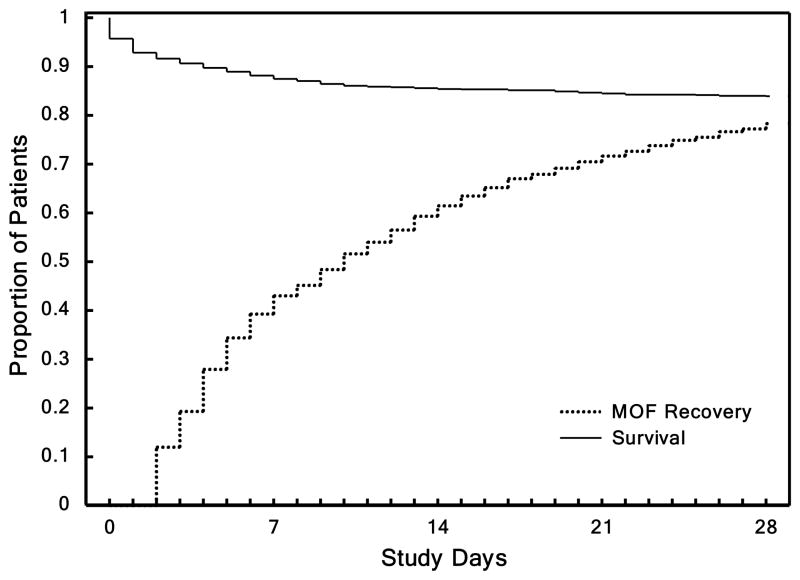
Results: The study patients were critically injured and were in shock. SOP compliance improved 10% to 40% during the study period. Multiple organ failure and mortality rates were 34.8% and 16.7%, respectively. Time to recovery, defined as the time until the patient was free of organ failure for at least 2 consecutive days, was developed as a new outcome measure. There was a reduction in mortality rate in the cohort during the study that cannot be explained by changes in the patient population.
Conclusions: This study provides the current benchmark and the overall positive effect of implementing SOPs for severely injured patients. Over the course of the study, there were improvements in morbidity and mortality rates and increasing compliance with SOPs. Mortality was surprisingly low, given the degree of injury, and improved over the duration of the study, which correlated with improved SOP compliance.
Trial registration: ClinicalTrials.gov NCT00257231.
Figures
References
-
- Health, United States, 2008 with Chartbook. Hyattsville, Md: National Center for Health Statistics; 2009.
-
- Heron M, Hoyert DL, Murphy SL, Xu J. National vital statistics reports 2009. 14. Vol. 57. Hyattsville, Md: National Center for Health Statistics; 2009. Deaths: Final data for 2006. - PubMed
-
- Bergen G, Chen LH, Warner M, Fingerhut LA. Injury in the United States: 2007 Chartbook. Hyattsville, Md: National Center for Health Statistics; 2007.
-
- Evans JA, Van Wessem KJ, McDougall D, Lee KA, Lyons T, Balogh ZJ. Epidemiology of traumatic deaths: comprehensive population-based assessment. World J Surg. 2010 Jan;34(1):158–63. - PubMed
-
- Dewar D, Moore FA, Moore EE, Balogh Z. Postinjury multiple organ failure. Injury. 2009 Sep;40(9):912–8. - PubMed
Publication types
MeSH terms
Associated data
Grants and funding
LinkOut - more resources
Full Text Sources
Medical
