. 2012 Mar 28:3:46.
doi: 10.3389/fgene.2012.00046. eCollection 2012.

Regulation of miRNA 219 and miRNA Clusters 338 and 17-92 in Oligodendrocytes

Affiliations

Regulation of miRNA 219 and miRNA Clusters 338 and 17-92 in Oligodendrocytes

Omar de Faria Jr et al. Front Genet. .

Abstract

MicroRNAs (miRs) regulate diverse molecular and cellular processes including oligodendrocyte (OL) precursor cell (OPC) proliferation and differentiation in rodents. However, the role of miRs in human OPCs is poorly understood. To identify miRs that may regulate these processes in humans, we isolated OL lineage cells from human white matter and analyzed their miR profile. Using endpoint RT-PCR assays and quantitative real-time PCR, we demonstrate that miR-219, miR-338, and miR-17-92 are enriched in human white matter and expressed in acutely isolated human OLs. In addition, we report the expression of closely related miRs (miR-219-1-3p, miR-219-2-3p, miR-1250, miR-657, miR-3065-5p, miR-3065-3p) in both rodent and human OLs. Our findings demonstrate that miRs implicated in rodent OPC proliferation and differentiation are regulated in human OLs and may regulate myelination program in humans. Thus, these miRs should be recognized as potential therapeutic targets in demyelinating disorders.

Keywords: differentiation; microRNA; myelination; oligodendrocyte precursor cell.


Figures

Figure 1
Figure 1
Validation of miR-specific primers. Endpoint RT-PCR followed by polyacrylamide gel electrophoresis showing that all miR primers yield a unique RT-PCR product with an expected amplicon of ∼70 nts. The entire gels are shown. Rat OPC (lane 1; 1 DIV and lane 2; 5 DIV), human brain (lane 3; h gray matter and lane 4; h white matter) and water control (lane 5). (A) Amplification of miRs 219 loci products yield a single amplicon in both human and rodent samples. (B) Amplification of miR-338 cluster products yields a single amplicon in both human and rodent samples, except for 3065-5p which was undetectable in the human samples used at this time. Note that miR-1250 and miR-657 are only predicted to be expressed by humans, thus, only the human samples are shown. (C) Amplification of miR-17-92 cluster products yields a single amplicon in both human and rodent samples. (D) Representative melting point analysis for each primer pair. The derivative of dissociations confirms that a single major amplicon is generated during quantitative real-time RT-PCR. The representative curves are average of four replicates.
Figure 2
Figure 2
Regulation of miR-219 expression during OPC differentiation. (A) Schematic showing human mir-219-1 and mir-219-2 genomic structures. Processing of the precursor transcripts generates the same miR-219-5p and two unique miRs, 219-1-3p and 219-2-3p. (B) Quantitative real-time RT-PCR showing elevation in all three mature products during postnatal mouse brain development. ΔΔCt method was used to calculate miR levels normalized to 18S RNA expression. Each time point represents at least three pooled animals analyzed in triplicates. P values are derived from one-way ANOVA analysis followed by the Tukey’s post-test. **P < 0.01; ***P < 0.001. (C) Left panel: endpoint RT-PCR followed by agarose gel electrophoresis showing that early OPC genes are downregulated and myelin genes are upregulated when rat OPCs are cultured in vitro in the absence of mitogens. Right panel: western blot showing that PLP is upregulated during OPC differentiation. (D) Quantitative real-time RT-PCR showing upregulation of all three mature miR-219 products during rat OPC differentiation in vitro. ΔΔCt method was used to calculate miR levels normalized to 18S RNA expression. The graphs are representative of one of the three experiments performed in triplicates. P values are derived from one-way ANOVA analysis followed the Tukey’s post-test. **P < 0.01; ***P < 0.001. (E) Pearson correlation between miR-219-5p and PLP levels during rat OPC differentiation in vitro. miRNA levels were calculated as described in (D). P value is derived from two-tailed unpaired Student’s t-test. P < 0.05. (F) Endpoint RT-PCR followed by polyacrylamide gel electrophoresis showing that all three mature miR-219 products are expressed in the human brain. (G) Quantitative real-time RT-PCR showing that miR-219 mature products are enriched in human brain white matter. ΔΔCt method was used to calculate miR levels normalized to 18S RNA expression. Fold-change was calculated by dividing miR levels in white matter by levels in gray matter. The graphs are obtained from analysis of two brains done in triplicates. P values are derived from two-tailed unpaired Student’s t-test. (H) Endpoint RT-PCR followed by polyacrylamide gel electrophoresis showing that miR-219 mature products are expressed by human A2B5+ OLs. (I) Quantitative real-time RT-PCR showing that miR-219 levels are higher in adult human A2B5+ cells when compared to A2B5 OLs. ΔΔCt method was used to calculate miR levels normalized to 18S RNA expression. Each bar represents the average of four subjects analyzed by real-time PCR done in triplicates. P values are derived from two-tailed unpaired Student’s t-test. *P < 0.05.
Figure 3
Figure 3
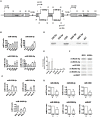
Regulation of miR-338 cluster expression during OPC differentiation. (A) Schematic showing human mir-338 cluster genomic structure. Note that miR-3065 is encoded by the complementary strand of miR-338. (B) Quantitative real-time PCR showing that overall expression of miR-338 cluster increases in the mouse brain during postnatal development. ΔΔCt method was used to calculate miR levels normalized to 18S RNA expression Each time point represents at least three pooled animals analyzed in triplicates. P values are derived from one-way ANOVA analysis followed by the Tukey’s post-test. *P < 0.05; **P < 0.01; ***P < 0.001. (C) Quantitative real-time PCR showing upregulation in miR-338-5p and -3p and downregulation of miR-3065-5p during rat OPC differentiation in vitro. ΔΔCt method was used to calculate miR levels normalized to 18S RNA expression. The graphs are representative of one of the three experiments performed in triplicates. P values are derived from one-way ANOVA analysis followed by the Tukey’s post-test. **P < 0.01; ***P < 0.001. (D) Endpoint RT-PCR followed by polyacrylamide gel electrophoresis showing that the miR-338 cluster is expressed in the human brain. (E) Quantitative real-time PCR showing that all members of the miR-338 cluster except for miRs 3065-5p and -3p are enriched in human brain white matter. ΔΔCt method was used to calculate miR levels normalized to 18S RNA expression. Fold-change was calculated by dividing miR levels in white matter by levels in gray matter. The graphs are obtained from analysis of two different brains done in triplicates. P values are derived from two-tailed unpaired Student’s t-test. (F) Endpoint RT-PCR followed by polyacrylamide gel electrophoresis showing that miR-338 cluster is expressed by the human cell line MO3.13 and human A2B5+ OLs. (G) Quantitative real-time PCR showing that levels of some miR-338 cluster members are higher in adult human A2B5+ cells than A2B5 OLs. ΔΔCt method was used to calculate miR levels normalized to 18S RNA expression. Each bar represents the average of four subjects analyzed by real-time PCR done in triplicates. P values are derived from two-tailed unpaired Student’s t-test. *P < 0.05.
Figure 4
Figure 4
Regulation of miR-17-92 cluster expression during OPC differentiation. (A) Schematic showing the human mir-17-92 cluster genomic structure. (B) Quantitative real-time PCR showing that levels of members of the miR-17-92 cluster are dramatically downregulated during postnatal mouse brain development. ΔΔCt method was used to calculate miR levels normalized to 18S RNA expression. Each time point represents at least three pooled animals analyzed in triplicates. P values are derived from one-way ANOVA analysis followed by the Tukey’s post-test. **P < 0.01; ***P < 0.001. (C) Quantitative real-time PCR showing that levels of members of the miR-17-92 cluster are downregulated during rat OPC differentiation in vitro. ΔΔCt method was used to calculate miR levels normalized to 18S RNA expression. The graphs are representative of one of the three experiments performed in triplicates. P values are derived from one-way ANOVA analysis followed by the Tukey’s post-test. **P < 0.01; ***P < 0.001. (D) Endpoint RT-PCR followed by polyacrylamide gel electrophoresis showing that miR-17-92 members are expressed in the human brain. (E) Quantitative real-time PCR showing that miR-17-92 members are enriched in the human brain white matter. ΔΔCt method was used to calculate miR levels normalized to 18S RNA expression. Fold-change was calculated by dividing miR levels in white matter by levels in gray matter. The graphs are obtained from analysis of two brains done in triplicates. P values are derived from two-tailed unpaired Student’s t-test. (F) Endpoint RT-PCR followed by polyacrylamide gel electrophoresis showing that miR-17-92 members are expressed by MO3.13 cells and human A2B5+ OLs. (G) Quantitative real-time PCR analysis of the miR-17-92 cluster members in human A2B5+ and A2B5 OLs shows no difference in expression between the two cell types. ΔΔCt method was used to calculate miR levels normalized to 18S RNA expression. Each bar represents the average of four subjects analyzed by real-time PCR done in triplicates. P values are derived from two-tailed unpaired Student’s t-test.

References

    1. Armstrong R. C. (1998). Isolation and characterization of immature oligodendrocyte lineage cells. Methods 16, 282–29210.1006/meth.1998.0685 - DOI - PubMed
    1. Barad O., Meiri E., Avniel A., Aharonov R., Barzilai A., Bentwich I., Einav U., Gilad S., Hurban P., Karov Y., Lobenhofer E. K., Sharon E., Shiboleth Y. M., Shtutman M., Bentwich Z., Einat P. (2004). MicroRNA expression detected by oligonucleotide microarrays: system establishment and expression profiling in human tissues. Genome Res. 14, 2486–249410.1101/gr.2845604 - DOI - PMC - PubMed
    1. Budde H., Schmitt S., Fitzner D., Opitz L., Salinas-Riester G., Simons M. (2010). Control of oligodendroglial cell number by the miR-17-92 cluster. Development 137, 2127–213210.1242/dev.050633 - DOI - PubMed
    1. Chen C., Ridzon D. A., Broomer A. J., Zhou Z., Lee D. H., Nguyen J. T., Barbisin M., Xu N. L., Mahuvakar V. R., Andersen M. R., Lao K. Q., Livak K. J., Guegler K. J. (2005). Real-time quantification of microRNAs by stem-loop RT-PCR. Nucleic Acids Res. 33, e179.10.1093/nar/gni178 - DOI - PMC - PubMed
    1. Cui Q. L., Fragoso G., Miron V. E., Darlington P. J., Mushynski W. E., Antel J., Almazan G. (2010). Response of human oligodendrocyte progenitors to growth factors and axon signals. J. Neuropathol. Exp. Neurol. 69, 930–94410.1097/NEN.0b013e3181ef3be4 - DOI - PubMed

LinkOut - more resources