. 2012;7(3):e33771.
doi: 10.1371/journal.pone.0033771. Epub 2012 Mar 21.

FRET imaging of diatoms expressing a biosilica-localized ribose sensor

Affiliations

FRET imaging of diatoms expressing a biosilica-localized ribose sensor

Kathryn E Marshall et al. PLoS One. 2012.

Abstract

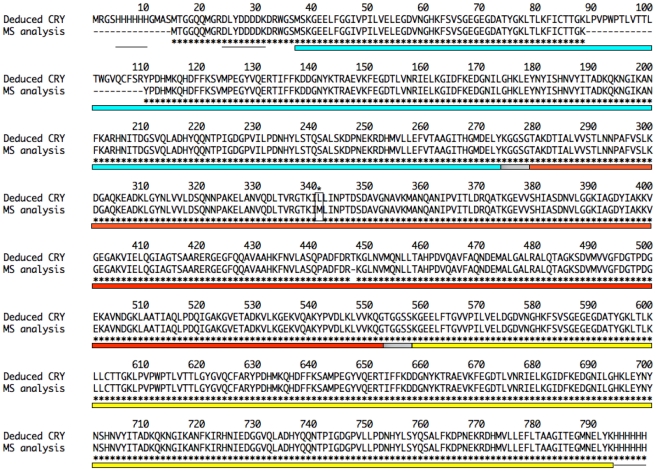
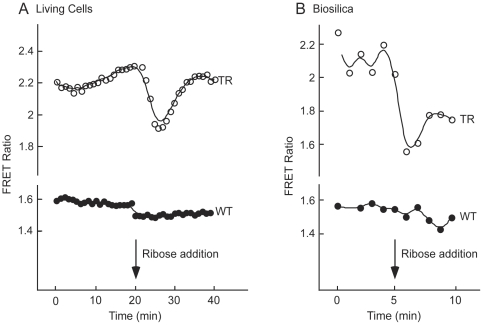
Future materials are envisioned to include bio-assembled, hybrid, three-dimensional nanosystems that incorporate functional proteins. Diatoms are amenable to genetic modification for localization of recombinant proteins in the biosilica cell wall. However, the full range of protein functionalities that can be accommodated by the modified porous biosilica has yet to be described. Our objective was to functionalize diatom biosilica with a reagent-less sensor dependent on ligand-binding and conformational change to drive FRET-based signaling capabilities. A fusion protein designed to confer such properties included a bacterial periplasmic ribose binding protein (R) flanked by CyPet (C) and YPet (Y), cyan and yellow fluorescent proteins that act as a FRET pair. The structure and function of the CRY recombinant chimeric protein was confirmed by expression in E. coli prior to transformation of the diatom Thalassiosira pseudonana. Mass spectrometry of the recombinant CRY showed 97% identity with the deduced amino acid sequence. CRY with and without an N-terminal Sil3 tag for biosilica localization exhibited characteristic ribose-dependent changes in FRET, with similar dissociation constants of 123.3 µM and 142.8 µM, respectively. The addition of the Sil3 tag did not alter the affinity of CRY for the ribose substrate. Subsequent transformation of T. pseudonana with a vector encoding Sil3-CRY resulted in fluorescence localization in the biosilica and changes in FRET in both living cells and isolated frustules in response to ribose. This work demonstrated that the nano-architecture of the genetically modified biosilica cell wall was able to support the functionality of the relatively complex Sil3-CyPet-RBP-YPet fusion protein with its requirement for ligand-binding and conformational change for FRET-signal generation.


Conflict of interest statement

Competing Interests: The authors have no support or funding to report.

Figures

Figure 1
Figure 1. Mass Spectrometry for Amino Acid Sequence Verification of the Deduced CRY Protein.
Protein samples were digested with gluC and trypsin proteases separately and analyzed using high resolution LC MS/MS. Mass spectrometry verified 97% of the deduced recombinant CRY sequence. The remaining 3% was either unidentified or represented 1 amino acid mismatch (*). Blue shading = CyPet sequence; Red shading = RBP sequence; Yellow shading = YPet sequence; Gray = linker sequences; Black Lines = His6 and Xpress™ tags.
Figure 2
Figure 2. Model for Ribose-Induced Conformational Change in CRY and Associated Decrease in FRET.
Unbound: In the absence of ribose, the ribose-binding protein (RBP) is in an open configuration, with C and Y, which are attached to the amino and carboxyl termini of RBP, respectively, in close proximity to each other. When CRY is excited at 435 nm, the emission from C excites Y, resulting in a high 530/485 emission intensity ratio. Bound: Binding of ribose (R) by RBP induces a conformational change in RBP that separates the amino and carboxyl termini of RBP, thereby increasing the distance between C and Y. This increase in the distance decreases the energy transfer between the two fluorescent proteins, thereby decreasing the 530/485 emission intensity ratio. Thus, increases in ribose concentrations result in decreases in FRET.
Figure 3
Figure 3. Ribose-Dependent FRET in Recombinant CRY and Sil3-CRY Expressed in E. coli.
Isolated CRY and Sil3-CRY protein samples were treated with various concentrations of ribose ranging from 1 µM to 10 mM. The Kd's for CRY and Sil3-CRY are not significantly different from each other (see Materials and Methods for details on Kd calculations and statistical analysis).
Figure 4
Figure 4. Fluorescent Images of Transformed and Untransformed Living Diatoms and Isolated Biosilica.
(A) Fluorescence microscopy: Live transformed cells and isolated biosilica frustules were imaged for brightfield to display cell structure and for cyan fluorescence of CyPet and red auto-fluorescence to show their respective localization in the biosilica and chloroplasts. The lack of red auto-fluorescence in the isolated biosilica highlights the absence of chloroplasts and therefore, the lack of cellular material within the biosilica cell wall. (B) Imaging flow cytometry: pTpfcp/Sil3-CRY:fcp/nat- transformed (TR) and untransformed (WT) cells were imaged for brightfield, cyan fluorescence of CyPet, yellow fluorescence of YPet from FRET, and chloroplast auto-fluorescence. Cyan, yellow, and red images were merged to highlight the fluorescence of CyPet and YPet flanking the chloroplasts. Only the red auto-fluorescence of chloroplasts was detected in the WT cells.
Figure 5
Figure 5. Ribose-Dependent FRET Imaging in Living, Transformed Diatoms and Isolated Biosilica.
(A) Time lapse imaging of living cells was used to image the CyPet and YPet fluorescence before and after addition of 300 mM ribose. Fluorescent images were captured simultaneously in both fluorescent channels every min for 40 min. Ribose was added to the cells at 20 min following initial imaging. The FRET ratio (530/485 nm RFU ratio) decreases upon addition of ribose. (B) Similarly, time lapse imaging of biosilica cell walls was carried out for 10 min with the addition of 300 mM ribose after 5 min. The FRET ratio decreases in response to ribose addition.
Figure 6
Figure 6. Concentration-Response of pTpfcp/Sil3-CRY:fcp/nat-transformed Diatoms Exposed to Ribose.
Normalized ΔFRET values (ΔFn) for individual cells treated with ribose. The EC50 of 23.3±4.7 mM (mean ± S.E.) corresponds to the ribose concentration resulting in 50% of the maximal ΔFn value.

References

    1. Chen J, Doumamidis H, Lyons K, Murday J, Roco MC. Manufacturing at the Nanoscale. National Nanotechnology Initiative Workshop Report 2007
    1. Gordon R, Parkinson J. Potential roles for diatomists in nanotechnology. Journal of Nanoscience and Nanotechnology. 2005;5:35–40. - PubMed
    1. Chang CH, Wang W, Gutu T, Gale DK, Jiao J, et al. Self-Assembly of Nanostructured Diatom Microshells into Patterned Arrays Assisted by Polyelectrolyte Multilayer Deposition and Inkjet Printing. Journal of the American Chemical Society. 2009;131:4178. - PubMed
    1. Kent MS, Murton JK, Satija S, Kuzmenko I, Simmons BA. Nanosilica Formation at Lipid Membranes Induced by Silaffin Peptides. Structure-Property Relationships in Biomineralized and Biomimetic Composites. 2009;1187:95–100.
    1. Kröger N, Deutzmann R, Sumper M. Polycationic peptides from diatom biosilica that direct silica nanosphere formation. Science. 1999;286:1129–1132. - PubMed

Publication types

MeSH terms