

Saposin C coupled lipid nanovesicles specifically target arthritic mouse joints for optical imaging of disease severity
- PMID: 22470501
- PMCID: PMC3314692
- DOI: 10.1371/journal.pone.0033966
Saposin C coupled lipid nanovesicles specifically target arthritic mouse joints for optical imaging of disease severity
Abstract
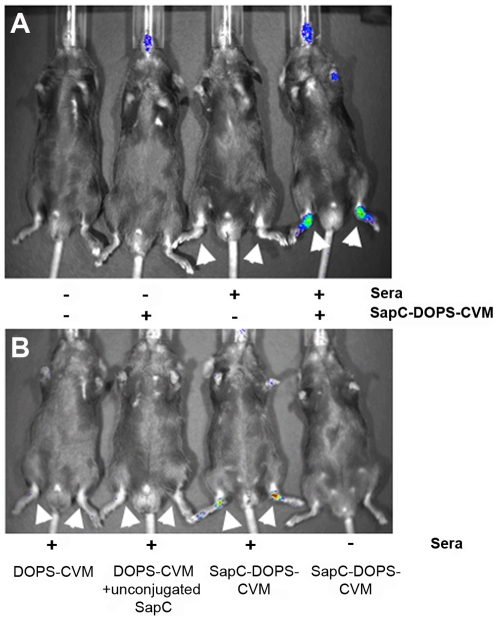
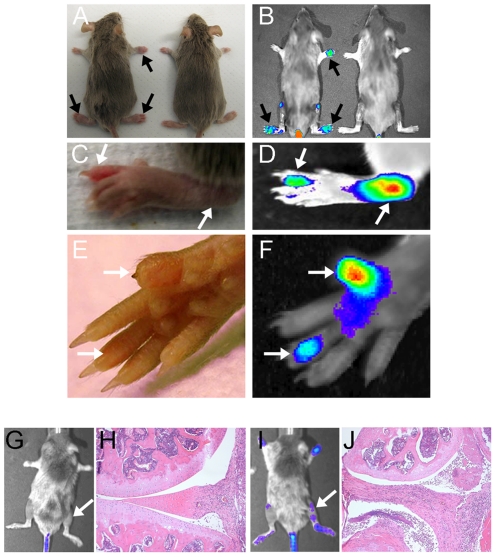
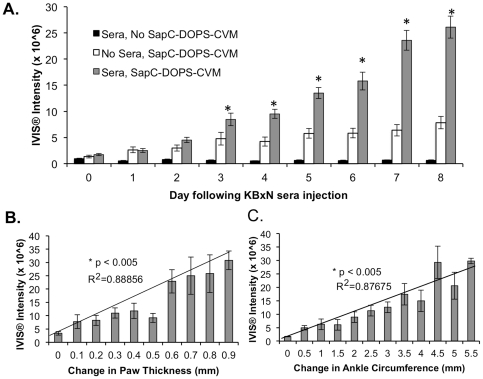
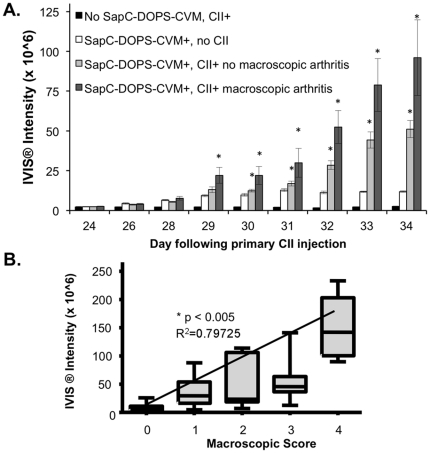
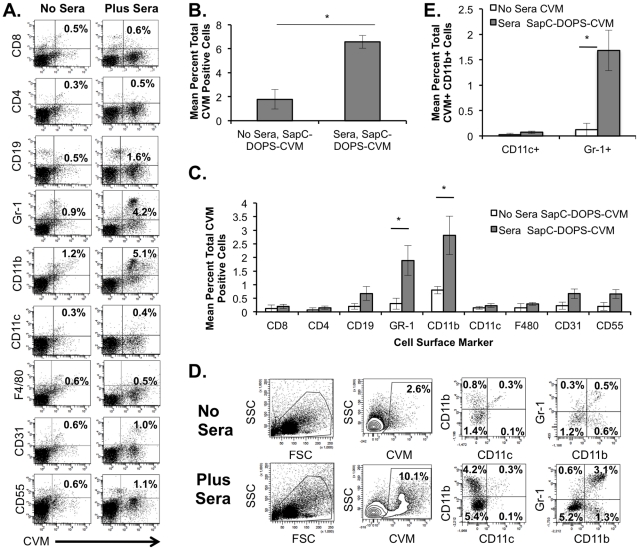
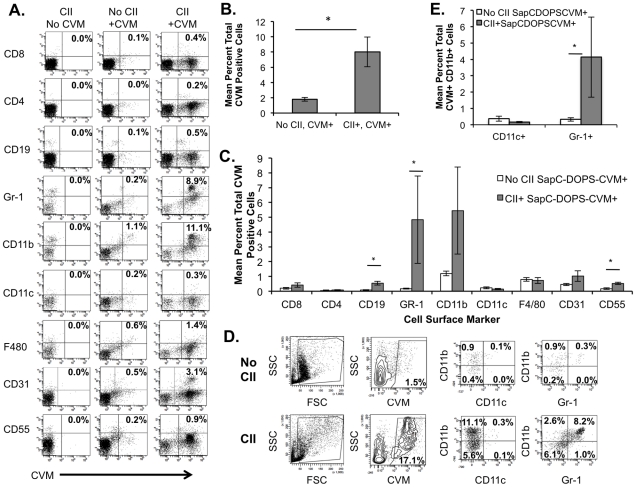
Rheumatoid arthritis is a chronic inflammatory disease affecting approximately 1% of the population and is characterized by cartilage and bone destruction ultimately leading to loss of joint function. Early detection and intervention of disease provides the best hope for successful treatment and preservation of joint mobility and function. Reliable and non-invasive techniques that accurately measure arthritic disease onset and progression are lacking. We recently developed a novel agent, SapC-DOPS, which is composed of the membrane-associated lysosomal protein saposin C (SapC) incorporated into 1,2-dioleoyl-sn-glycero-3-phospho-L-serine (DOPS) lipid nanovesicles. SapC-DOPS has a high fusogenic affinity for phosphatidylserine-enriched microdomains on surfaces of target cell membranes. Incorporation of a far-red fluorophore, CellVue Maroon (CVM), into the nanovesicles allows for in vivo non-invasive visualization of the agent in targeted tissue. Given that phosphatidylserine is present only on the inner leaflet of healthy plasma membranes but is "flipped" to the outer leaflet upon cell damage, we hypothesized that SapC-DOPS would target tissue damage associated with inflammatory arthritis due to local surface-exposure of phosphatidylserine. Optical imaging with SapC-DOPS-CVM in two distinct models of arthritis, serum-transfer arthritis (e.g., K/BxN) and collagen-induced arthritis (CIA) revealed robust SapC-DOPS-CVM specific localization to arthritic paws and joints in live animals. Importantly, intensity of localized fluorescent signal correlated with macroscopic arthritic disease severity and increased with disease progression. Flow cytometry of cells extracted from arthritic joints demonstrated that SapC-DOPS-CVM localized to an average of 7-8% of total joint cells and primarily to CD11b+Gr-1+ cells. Results from the current studies strongly support the application of SapC-DOPS-CVM for advanced clinical and research applications including: detecting early arthritis onset, assessing disease progression real-time in live subjects, and providing novel information regarding cell types that may mediate arthritis progression within joints.
Conflict of interest statement
Figures
Similar articles
-
Detection of cancer cells using SapC-DOPS nanovesicles.Mol Cancer. 2016 May 10;15(1):33. doi: 10.1186/s12943-016-0519-1. Mol Cancer. 2016. PMID: 27160923 Free PMC article. Review.
-
In vivo optical imaging of brain tumors and arthritis using fluorescent SapC-DOPS nanovesicles.J Vis Exp. 2014 May 2;(87):51187. doi: 10.3791/51187. J Vis Exp. 2014. PMID: 24837630 Free PMC article.
-
CellVue Maroon–labeled saposin C-dioleylphosphatidylserine nanovesicles.2011 Jun 20 [updated 2011 Jul 18]. In: Molecular Imaging and Contrast Agent Database (MICAD) [Internet]. Bethesda (MD): National Center for Biotechnology Information (US); 2004–2013. 2011 Jun 20 [updated 2011 Jul 18]. In: Molecular Imaging and Contrast Agent Database (MICAD) [Internet]. Bethesda (MD): National Center for Biotechnology Information (US); 2004–2013. PMID: 21796833 Free Books & Documents. Review.
-
Targeting and cytotoxicity of SapC-DOPS nanovesicles in pancreatic cancer.PLoS One. 2013 Oct 4;8(10):e75507. doi: 10.1371/journal.pone.0075507. eCollection 2013. PLoS One. 2013. PMID: 24124494 Free PMC article.
-
Saposin C-dioleylphosphatidylserine nanovesicles coupled with iron oxides.2011 Jun 20 [updated 2011 Jul 18]. In: Molecular Imaging and Contrast Agent Database (MICAD) [Internet]. Bethesda (MD): National Center for Biotechnology Information (US); 2004–2013. 2011 Jun 20 [updated 2011 Jul 18]. In: Molecular Imaging and Contrast Agent Database (MICAD) [Internet]. Bethesda (MD): National Center for Biotechnology Information (US); 2004–2013. PMID: 21796836 Free Books & Documents. Review.
Cited by
-
Systemic enzyme delivery by blood-brain barrier-penetrating SapC-DOPS nanovesicles for treatment of neuronopathic Gaucher disease.EBioMedicine. 2020 May;55:102735. doi: 10.1016/j.ebiom.2020.102735. Epub 2020 Apr 10. EBioMedicine. 2020. PMID: 32279952 Free PMC article.
-
"Eat me" imaging and therapy.Adv Drug Deliv Rev. 2016 Apr 1;99(Pt A):2-11. doi: 10.1016/j.addr.2016.01.009. Epub 2016 Jan 27. Adv Drug Deliv Rev. 2016. PMID: 26826436 Free PMC article. Review.
-
Detection of cancer cells using SapC-DOPS nanovesicles.Mol Cancer. 2016 May 10;15(1):33. doi: 10.1186/s12943-016-0519-1. Mol Cancer. 2016. PMID: 27160923 Free PMC article. Review.
-
Phosphatidylserine-selective targeting and anticancer effects of SapC-DOPS nanovesicles on brain tumors.Oncotarget. 2014 Aug 30;5(16):7105-18. doi: 10.18632/oncotarget.2214. Oncotarget. 2014. PMID: 25051370 Free PMC article.
-
In vivo optical imaging of brain tumors and arthritis using fluorescent SapC-DOPS nanovesicles.J Vis Exp. 2014 May 2;(87):51187. doi: 10.3791/51187. J Vis Exp. 2014. PMID: 24837630 Free PMC article.
References
-
- Sokka T, Pincus T. Joint counts to assess rheumatoid arthritis for clinical research and usual clinical care: advantages and limitations. Rheum Dis Clin North Am. 2009;35:713–722, v–vi. - PubMed
-
- Katz JD, Nayyar G, Noeth E. Overview of imaging in inflammatory arthritis. Ann N Y Acad Sci. 2009;1154:10–17. - PubMed
-
- Kubassova O, Boesen M, Peloschek P, Langs G, Cimmino MA, et al. Quantifying disease activity and damage by imaging in rheumatoid arthritis and osteoarthritis. Ann N Y Acad Sci. 2009;1154:207–238. - PubMed
-
- Fouque-Aubert A, Chapurlat R, Miossec P, Delmas PD. A comparative review of the different techniques to assess hand bone damage in rheumatoid arthritis. Joint Bone Spine. 2010;77:212–217. - PubMed
Publication types
MeSH terms
Substances
Grants and funding
LinkOut - more resources
Full Text Sources
Other Literature Sources
Research Materials
