

Mathematical modeling of malaria infection with innate and adaptive immunity in individuals and agent-based communities
- PMID: 22470511
- PMCID: PMC3314696
- DOI: 10.1371/journal.pone.0034040
Mathematical modeling of malaria infection with innate and adaptive immunity in individuals and agent-based communities
Abstract
Background: Agent-based modeling of Plasmodium falciparum infection offers an attractive alternative to the conventional Ross-Macdonald methodology, as it allows simulation of heterogeneous communities subjected to realistic transmission (inoculation patterns).
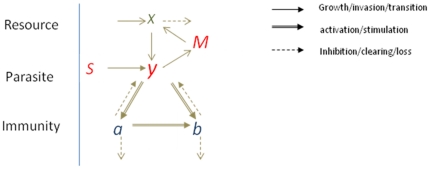
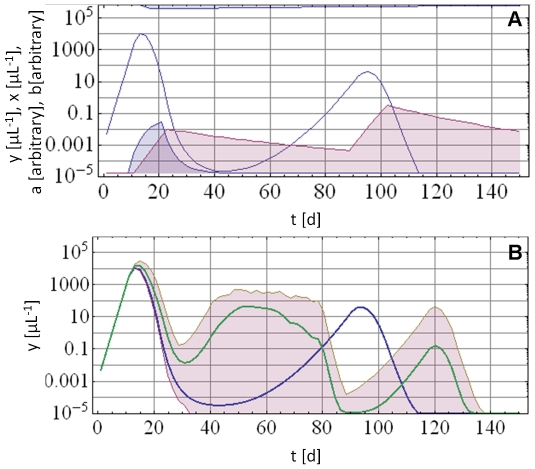
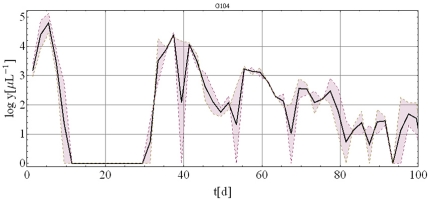
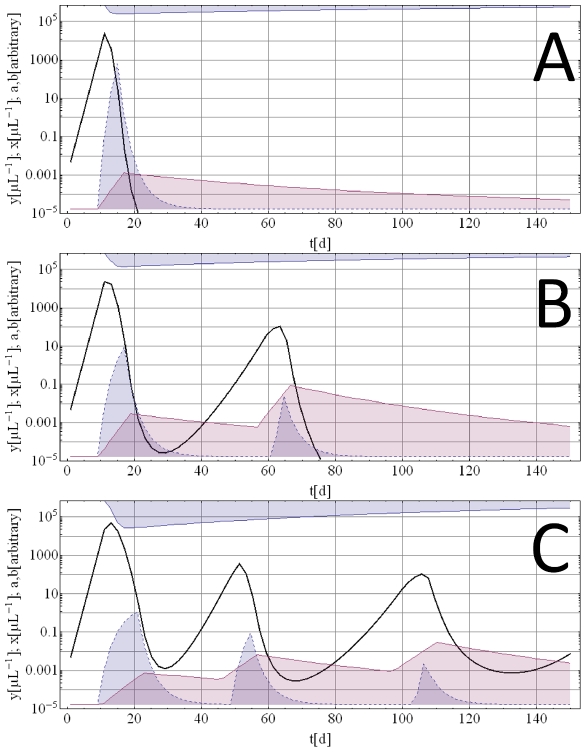
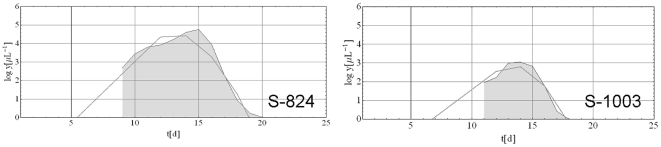
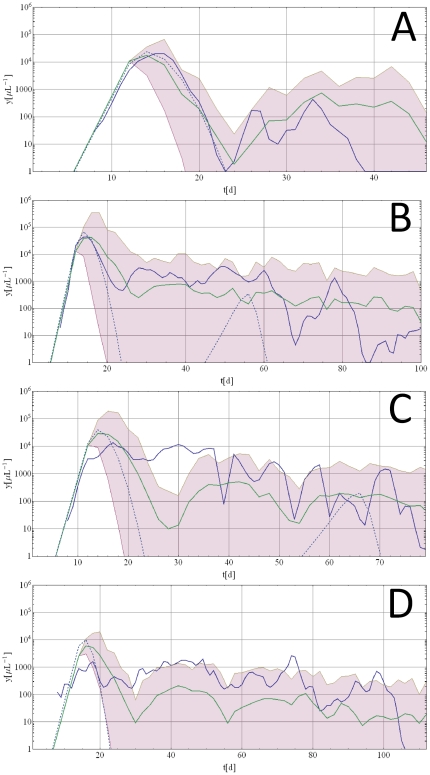
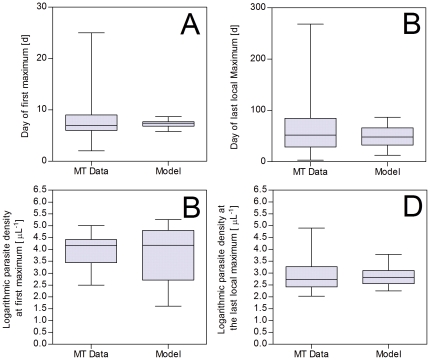
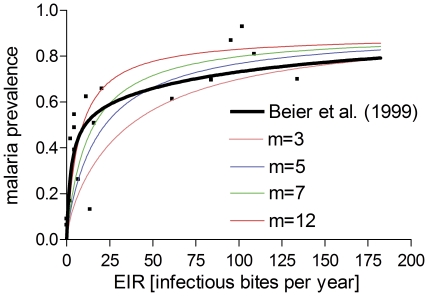
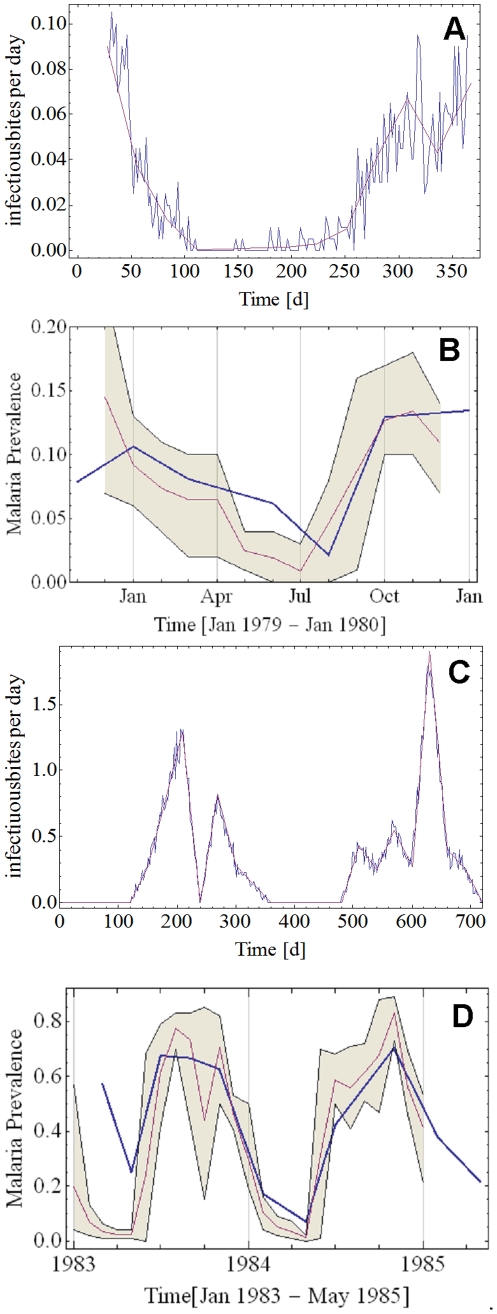
Methodology/principal findings: We developed a new, agent based model that accounts for the essential in-host processes: parasite replication and its regulation by innate and adaptive immunity. The model also incorporates a simplified version of antigenic variation by Plasmodium falciparum. We calibrated the model using data from malaria-therapy (MT) studies, and developed a novel calibration procedure that accounts for a deterministic and a pseudo-random component in the observed parasite density patterns. Using the parasite density patterns of 122 MT patients, we generated a large number of calibrated parameters. The resulting data set served as a basis for constructing and simulating heterogeneous agent-based (AB) communities of MT-like hosts. We conducted several numerical experiments subjecting AB communities to realistic inoculation patterns reported from previous field studies, and compared the model output to the observed malaria prevalence in the field. There was overall consistency, supporting the potential of this agent-based methodology to represent transmission in realistic communities.
Conclusions/significance: Our approach represents a novel, convenient and versatile method to model Plasmodium falciparum infection.
Conflict of interest statement
Figures
Similar articles
-
Mechanistic within-host models of the asexual Plasmodium falciparum infection: a review and analytical assessment.Malar J. 2021 Jul 10;20(1):309. doi: 10.1186/s12936-021-03813-z. Malar J. 2021. PMID: 34246274 Free PMC article.
-
P. falciparum infection durations and infectiousness are shaped by antigenic variation and innate and adaptive host immunity in a mathematical model.PLoS One. 2012;7(9):e44950. doi: 10.1371/journal.pone.0044950. Epub 2012 Sep 19. PLoS One. 2012. PMID: 23028698 Free PMC article.
-
Innate immunity induced by Plasmodium liver infection inhibits malaria reinfections.Infect Immun. 2015 Mar;83(3):1172-80. doi: 10.1128/IAI.02796-14. Epub 2015 Jan 12. Infect Immun. 2015. PMID: 25583524 Free PMC article.
-
Human Vγ9Vδ2 T Lymphocytes in the Immune Response to P. falciparum Infection.Front Immunol. 2018 Nov 27;9:2760. doi: 10.3389/fimmu.2018.02760. eCollection 2018. Front Immunol. 2018. PMID: 30538708 Free PMC article. Review.
-
Parasite Recognition and Signaling Mechanisms in Innate Immune Responses to Malaria.Front Immunol. 2018 Dec 19;9:3006. doi: 10.3389/fimmu.2018.03006. eCollection 2018. Front Immunol. 2018. PMID: 30619355 Free PMC article. Review.
Cited by
-
Modeling within-host effects of drugs on Plasmodium falciparum transmission and prospects for malaria elimination.PLoS Comput Biol. 2014 Jan;10(1):e1003434. doi: 10.1371/journal.pcbi.1003434. Epub 2014 Jan 23. PLoS Comput Biol. 2014. PMID: 24465196 Free PMC article.
-
A spatial agent-based model of Anopheles vagus for malaria epidemiology: examining the impact of vector control interventions.Malar J. 2017 Oct 27;16(1):432. doi: 10.1186/s12936-017-2075-6. Malar J. 2017. PMID: 29078771 Free PMC article.
-
Agent-based models of malaria transmission: a systematic review.Malar J. 2018 Aug 17;17(1):299. doi: 10.1186/s12936-018-2442-y. Malar J. 2018. PMID: 30119664 Free PMC article.
-
Mechanistic within-host models of the asexual Plasmodium falciparum infection: a review and analytical assessment.Malar J. 2021 Jul 10;20(1):309. doi: 10.1186/s12936-021-03813-z. Malar J. 2021. PMID: 34246274 Free PMC article.
-
A spatial simulation model for dengue virus infection in urban areas.BMC Infect Dis. 2014 Aug 20;14:447. doi: 10.1186/1471-2334-14-447. BMC Infect Dis. 2014. PMID: 25139524 Free PMC article.
References
-
- Macdonald G. The Epidemiology and Control of Malaria. London: Oxford University Press; 1957.
-
- Ross R. The prevention of Malaria. London: John Murray; 1911.
Publication types
MeSH terms
Grants and funding
LinkOut - more resources
Full Text Sources
Medical
