. 2012:155:43-62; discussion 103-14.
doi: 10.1039/c1fd00098e.

Physical constraints on charge transport through bacterial nanowires

Affiliations

Physical constraints on charge transport through bacterial nanowires

Nicholas F Polizzi et al. Faraday Discuss. 2012.

Abstract

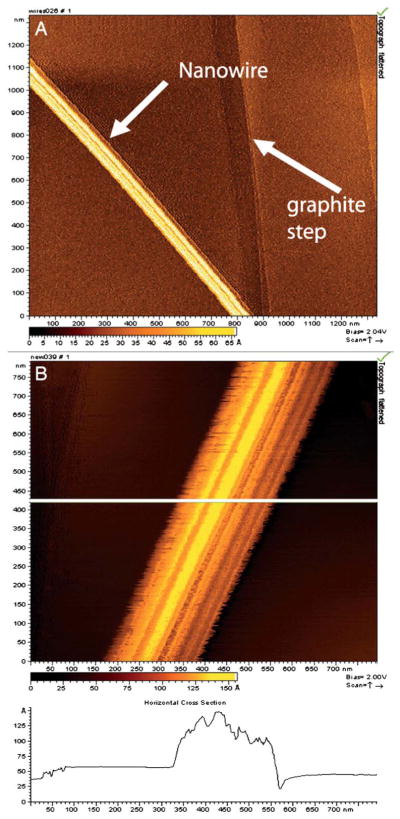
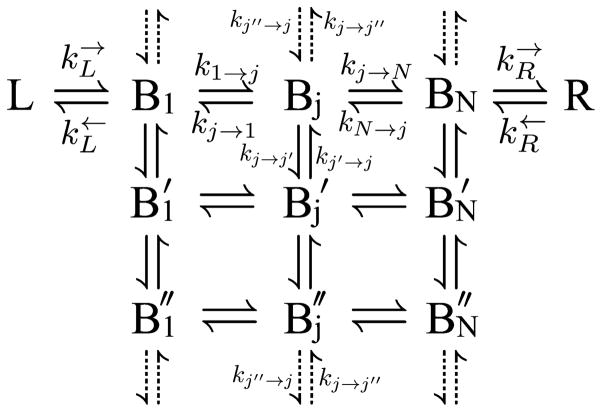
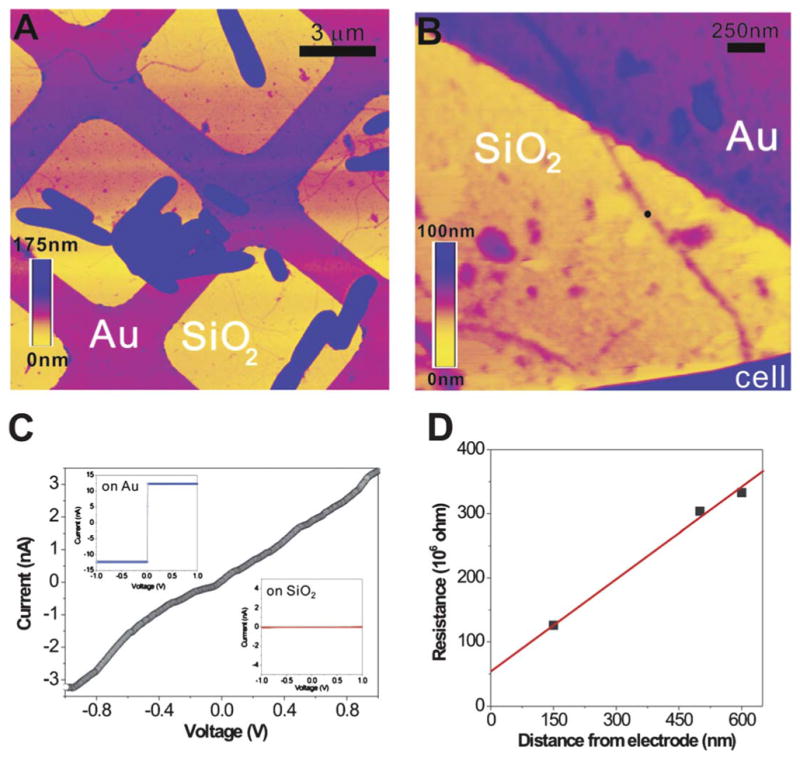
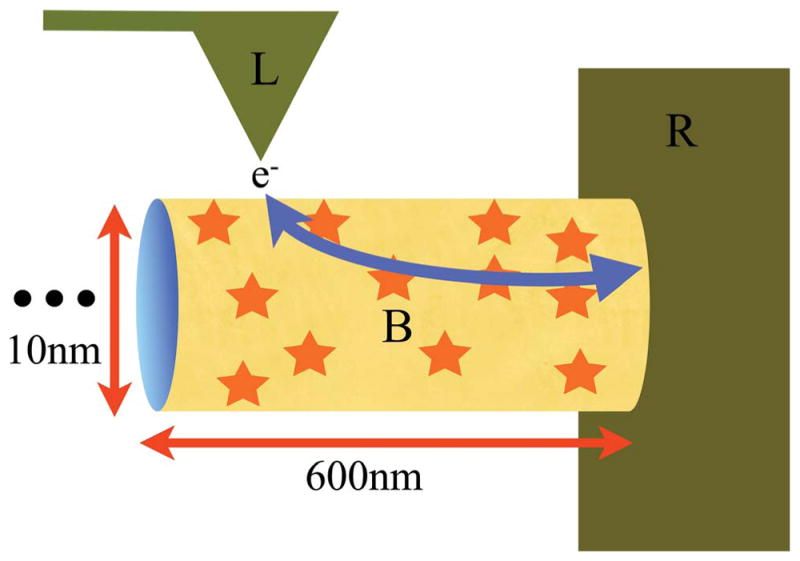
Extracellular appendages of the dissimilatory metal-reducing bacterium Shewanella oneidensis MR-1 were recently shown to sustain currents of 10(10) electrons per second over distances of 0.5 microns [El-Naggar et al., Proc. Natl. Acad. Sci. U. S. A., 2010, 107, 18127]. However, the identity of the charge localizing sites and their organization along the "nanowire" remain unknown. We use theory to predict redox cofactor separation distances that would permit charge flow at rates of 10(10) electrons per second over 0.5 microns for voltage biases of < or = IV, using a steady-state analysis governed by a non-adiabatic electron transport mechanism. We find the observed currents necessitate a multi-step hopping transport mechanism, with charge localizing sites separated by less than 1 nm and reorganization energies that rival the lowest known in biology.


Figures

Fig. 1
Fig. 1
STM images of isolated nanowires from wild-type MR-1, with a lateral diameter of 100 nm and a topographic height of between 5 and 10 nm. (A) Arrows indicate the location of a nanowire and a step on the graphite substrate. (B) Higher magnification showing ridges and troughs running along the long axis of the structures. Figure reproduced with permission. Copyright (2006) National Academy of Sciences, U.S.A.
Fig. 2
Fig. 2
The two dimensional rate mechanism consisting of a left electrode (L), a set of bridge sites {Bj}, a right electrode (R), and the transitions between them {k}. We define a “row” as all the bridge sites with the same identifying tick mark, and the total number of “rows” as Nrow. A “column” is all the sites with the same number subscript, and the total number of “columns” is Ncol. Cylindrical boundary conditions are satisfied when the vertical transitions described by the dotted arrows are included. The dotted transitions connect the last row of bridge sites with the first row. The mechanism can be generalized to more sites coupled in from the left electrode {L} and coupled out to the right electrode {R}.
Fig. 3
Fig. 3
CP-AFM of a bacterial nanowire. (A) Topographic AFM image showing air-dried S. oneidensis MR-1 cells and extracellular appendages deposited randomly on a SiO2/Si substrate patterned with Au microgrids. (B) Contact mode AFM image showing a nanowire reaching out from a bacterial cell to the Au electrode. (C) An IV curve obtained by probing the nanowire at a length of 600 nm away from the Au electrode (at the position marked by the black dot in B). (Inset) The IV curves obtained on bare Au and SiO2, respectively. (D) A plot of total resistance as a function of distance between CP-AFM tip and the Au electrode. Figure reproduced with permission. Copyright (2010) National Academy of Sciences, U.S.A.
Fig. 4
Fig. 4
Schematic of electron flow through a bacterial nanowire. The labels L, B and R stand for Left electrode, Bridge and Right electrode, respectively. Here, L is the conductive AFM tip of the experiment, B is the bacterial pilus and R is the gold grid shown in Fig. 3. The arrow gives the path of the electrons, with direction depending on the sign of the chemical potential difference between the electrodes. The star symbols on the pilus represent charge carriers on the surface. The “…” represents the pilus extending in length far to the left. The segment length of the pilus between the electrodes is 600 nm. The height and width of the ellipsoidal pilus is approximated by a diameter of 10 nm.
Fig. 5
Fig. 5
The hopping number dependence of the mean rate through a 1 or 2 dimensional bridge. The injection into and ejection out of the bridge were modeled as irreversible for each scenario in order to achieve a net flux from L to R. Lines labeled “with bias” have all backward rate constants set to zero. All other rate constants were k = 1013 s−1. “No bias” means forward and backward rate constants were equal, excepting the injection and ejection rate constants which have no backward rate. 2Dreg refers to a “regular” 2D lattice of hopping sites. 2Dcyl refers to a cylindrical and therefore periodic lattice of hopping sites. From the figure, one can estimate order of magnitude drops in the effective rate constant as a function of the number of hopping steps, with the assumption that all hopping rate constants throughout the kinetic scheme are equal. The effective rate constants decay by a power law with the number of sites, N. Each line is labeled with its fitted distance dependence and a letter A through F, corresponding to its diagramatic representation below.
Fig. 6
Fig. 6
Decaheme cytochrome MtrF from Shewanella oneidensis MR-1. Notice the close spacing of the Fe hemes, with typical edge-to-edge distance of ≤0.7 nm. pdb: 3pmq.
Fig. 7
Fig. 7
Contour plots of the current described by eqn (4.1) as a function of nearest neighbor hopping distance and number of electrode contacts. The reorganization energy, λ, the length of the bridge, L, and the exponential decay constant, β, were chosen for relevance to a bacterial pilus. For all cases, kBT was taken as 1/40 eV. The figure informs at a glance the distance and contact constraints imposed upon each 2D cylindrical system for a given magnitude of current.
Fig. 8
Fig. 8
The energy picture of an electrochemical electron transfer. The molecular redox species have state densities represented by gaussians (oxidized state: red, reduced state: blue). Applying a negative potential to the electrode moves the chemical potential μ up the energy scale. The electron transfer rate is related to the overlap between the Fermi function of the electrode and the gaussian density of states of the redox molecule. Note that at very negative applied potentials, the Fermi level of the electrode is far above the (red colored) gaussian of the oxidized species and the overlap of the two functions remains constant and saturated even when more negative potentials are applied. In this way, kred plateaus and saturates. Likewise for kox at large positive potentials.
Fig. 9
Fig. 9
The familiar form of the rate mechanism (see Fig. 2) is recast in terms of a closed loop, where state (L, R) represents the state from where an electron is entering or exiting. The symbols highlighted in blue are those included in a one dimensional bridge of length N. Inclusion of the black states makes this mechanism two dimensional. Applying the cylindrical boundary condition as described in the text makes this mechanism two dimensional and cylindrical. The dotted arrows represent transitions between the variable number of bridge sites between Bj and BN.
Fig. 10
Fig. 10
A nonequilibrium steady-state flux can be imposed on this two bridge rate mechanism (top) by either (A) making the last step irreversible, as is usually done, or (B) recasting in terms of a closed loop. In (B), the four state mechanism becomes a cyclical three state mechanism, from which the nonequilibrium steady-state flux is easily obtained without invoking irreversibility. Detailed balance dictates that kLk12kR=kRk21kL when ΔμRL = 0.

References

    1. Skourtis SS, Waldeck DH, Beratan DN. Annu Rev Phys Chem. 2010;61:461–485. - PMC - PubMed
    1. Beratan DN, Skourtis SS, Balabin IA, Balaeff A, Keinan S, Venkatramani R, Xiao D. Acc Chem Res. 2009;42:1669–1678. - PMC - PubMed
    1. Gray HB, Winkler JR. Biochim Biophys Acta, Bioenerg. 2010;1797:1563–1572. - PubMed
    1. Dempsey JL, Winkler JR, Gray HB. Chem Rev. 2010;110:7024–7039. - PMC - PubMed
    1. Beratan DN, Betts JN, Onuchic JN. Science. 1991;252:1285–1288. - PubMed

Publication types