

Altered frequency and phenotype of CD4+ forkhead box protein 3+ T cells and its association with autoantibody production in human immunodeficiency virus-infected paediatric patients
- PMID: 22471284
- PMCID: PMC3390524
- DOI: 10.1111/j.1365-2249.2012.04569.x
Altered frequency and phenotype of CD4+ forkhead box protein 3+ T cells and its association with autoantibody production in human immunodeficiency virus-infected paediatric patients
Abstract
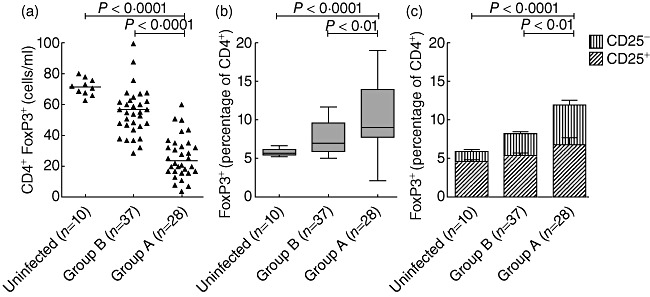
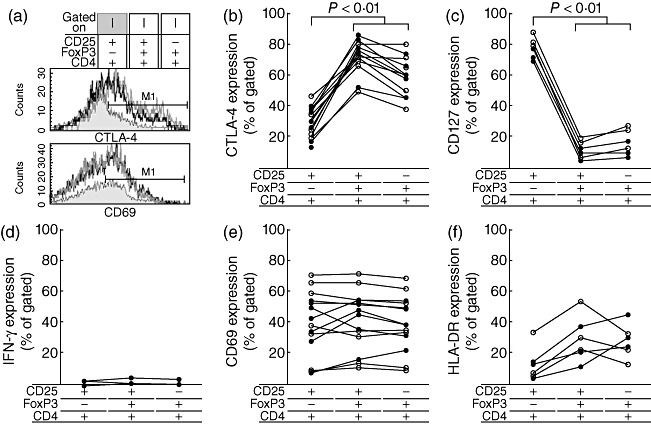
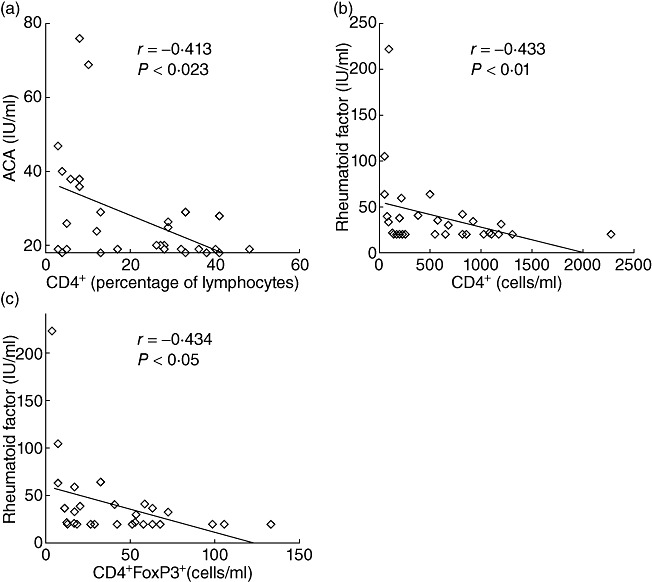
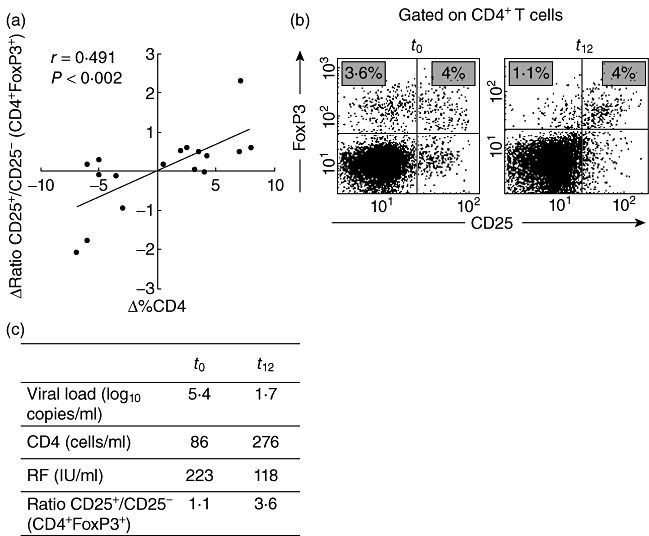
The association between immune dysfunction and the development of autoimmune pathology in patients with human immunodeficiency virus/acquired immune deficiency syndrome (HIV/AIDS) is not clear. The frequency and phenotype of regulatory T cells, as well as the presence of autoantibodies, were evaluated in a paediatric cohort of HIV-infected patients without clinical evidence of autoimmune disease. Lower absolute counts but higher percentages of total CD4(+) forkhead box protein 3 (FoxP3)(+) T cells were recorded in children with severe immunosuppression than in those without evidence of immunosuppression. The frequencies of classical CD4(+) CD25(+) FoxP3(+) regulatory T cells were not altered, whereas CD4(+) FoxP3(+) CD25(-) T cells were found increased significantly in patients with severe immunosuppression. Like classical regulatory T cells, CD4(+) FoxP3(+) CD25(-) T cells display higher cytotoxic T-lymphocyte antigen 4 (CTLA-4) but lower CD127 expression compared with CD4(+) FoxP3(-) CD25(+) T cells. An improvement in CD4(+) T cell counts, along with a decrease in viral load, was associated with a decrease in CD4(+) FoxP3(+) CD25(-) T cells. The majority of the patients with severe immunosuppression were positive for at least one out of seven autoantibodies tested and displayed hypergammaglobulinaemia. Conversely, HIV-infected children without evidence of immunosuppression had lower levels of autoantibodies and total immunoglobulins. A decline in CD4(+) FoxP3(+) T cell numbers or a variation in their phenotype may induce a raise in antigen exposure with polyclonal B cell activation, probably contributing to the generation of autoantibodies in the absence of clinical autoimmune disease.
© 2012 The Authors;Clinical and Experimental Immunology © 2012 British Society for Immunology.
Figures
Similar articles
-
Frequencies of FoxP3+ naive T cells are related to both viral load and naive T cell proliferation responses in HIV disease.J Leukoc Biol. 2011 Sep;90(3):621-8. doi: 10.1189/jlb.1210661. Epub 2011 Jun 7. J Leukoc Biol. 2011. PMID: 21653240 Free PMC article.
-
FOXP3+Helios+ Regulatory T Cells, Immune Activation, and Advancing Disease in HIV-Infected Children.J Acquir Immune Defic Syndr. 2016 Aug 15;72(5):474-84. doi: 10.1097/QAI.0000000000001000. J Acquir Immune Defic Syndr. 2016. PMID: 27003495 Free PMC article.
-
Severe immune dysregulation affects CD4⁺CD25(hi)FoxP3⁺ regulatory T cells in HIV-infected patients with low-level CD4 T-cell repopulation despite suppressive highly active antiretroviral therapy.J Infect Dis. 2012 May 15;205(10):1501-9. doi: 10.1093/infdis/jis230. Epub 2012 Mar 28. J Infect Dis. 2012. PMID: 22457273
-
Expanding Diversity and Common Goal of Regulatory T and B Cells. I: Origin, Phenotype, Mechanisms.Arch Immunol Ther Exp (Warsz). 2017 Dec;65(6):501-520. doi: 10.1007/s00005-017-0469-3. Epub 2017 May 5. Arch Immunol Ther Exp (Warsz). 2017. PMID: 28477096 Free PMC article. Review.
-
Emerging Role and Characterization of Immunometabolism: Relevance to HIV Pathogenesis, Serious Non-AIDS Events, and a Cure.J Immunol. 2016 Jun 1;196(11):4437-44. doi: 10.4049/jimmunol.1600120. J Immunol. 2016. PMID: 27207806 Free PMC article. Review.
Cited by
-
Immunity to HIV in Early Life.Front Immunol. 2014 Aug 12;5:391. doi: 10.3389/fimmu.2014.00391. eCollection 2014. Front Immunol. 2014. PMID: 25161656 Free PMC article. Review.
-
Gag-Specific CD8 T-Cell Proliferation Is Associated With Higher Peripheral Blood Levels of Transforming Growth Factor-β and Gut-Homing T Cells in Youths Perinatally Infected With Human Immunodeficiency Virus-1: The ANRS-EP38-IMMIP Study.Open Forum Infect Dis. 2016 Dec 7;4(1):ofw239. doi: 10.1093/ofid/ofw239. eCollection 2017 Winter. Open Forum Infect Dis. 2016. PMID: 28480237 Free PMC article.
-
Distinct monocyte subset phenotypes in patients with different clinical forms of chronic Chagas disease and seronegative dilated cardiomyopathy.PLoS Negl Trop Dis. 2018 Oct 22;12(10):e0006887. doi: 10.1371/journal.pntd.0006887. eCollection 2018 Oct. PLoS Negl Trop Dis. 2018. PMID: 30346948 Free PMC article.
-
Association between discordant immunological response to highly active anti-retroviral therapy, regulatory T cell percentage, immune cell activation and very low-level viraemia in HIV-infected patients.Clin Exp Immunol. 2014 Jun;176(3):401-9. doi: 10.1111/cei.12278. Clin Exp Immunol. 2014. PMID: 24460818 Free PMC article.
-
Forkhead box protein 3(+) regulatory T cells and Helios(+) subset in perinatally acquired HIV.Clin Exp Immunol. 2015 Apr;180(1):108-17. doi: 10.1111/cei.12560. Clin Exp Immunol. 2015. PMID: 25425428 Free PMC article. Clinical Trial.
References
-
- Adeegbe D, Bayer AL, Levy RB, Malek TR. Cutting edge: allogeneic CD4+CD25+Foxp3+ T regulatory cells suppress autoimmunity while establishing transplantation tolerance. J Immunol. 2006;176:7149–53. - PubMed
-
- Chang X, Zheng P, Liu Y. Homeostatic proliferation in the mice with germline Foxp3 mutation and its contribution to fatal autoimmunity. J Immunol. 2008;181:2399–406. - PubMed
-
- Piccirillo CA, d'Hennezel E, Sgouroudis E, Yurchenko E. CD4+Foxp3+ regulatory T cells in the control of autoimmunity: in vivo veritas. Curr Opin Immunol. 2008;20:655–62. - PubMed
-
- Kotsianidis I, Bouchliou I, Nakou E, et al. Kinetics, function and bone marrow trafficking of CD4+CD25+FOXP3+ regulatory T cells in myelodysplastic syndromes (MDS) Leukemia. 2009;23:510–18. - PubMed
-
- Card CM, McLaren PJ, Wachihi C, Kimani J, Plummer FA, Fowke KR. Decreased immune activation in resistance to HIV-1 infection is associated with an elevated frequency of CD4(+)CD25(+)FOXP3(+) regulatory T cells. J Infect Dis. 2009;199:1318–22. - PubMed
Publication types
MeSH terms
Substances
LinkOut - more resources
Full Text Sources
Medical
Research Materials
