

Cyclosporin but not everolimus inhibits chemokine receptor expression on CD4+ T cell subsets circulating in the peripheral blood of renal transplant recipients
- PMID: 22471287
- PMCID: PMC3390527
- DOI: 10.1111/j.1365-2249.2012.04571.x
Cyclosporin but not everolimus inhibits chemokine receptor expression on CD4+ T cell subsets circulating in the peripheral blood of renal transplant recipients
Abstract
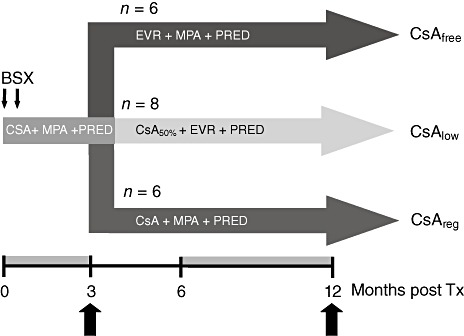
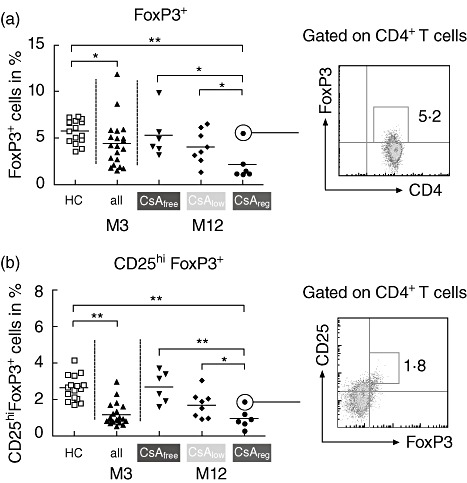
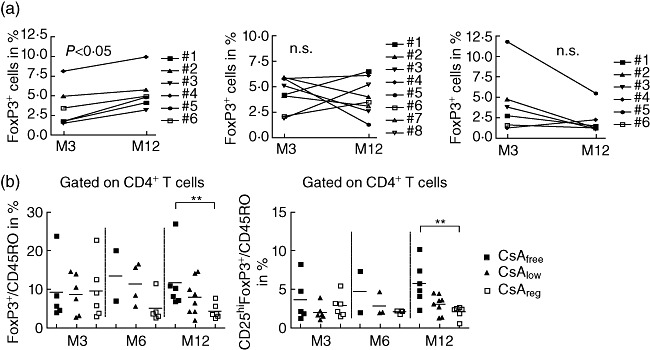
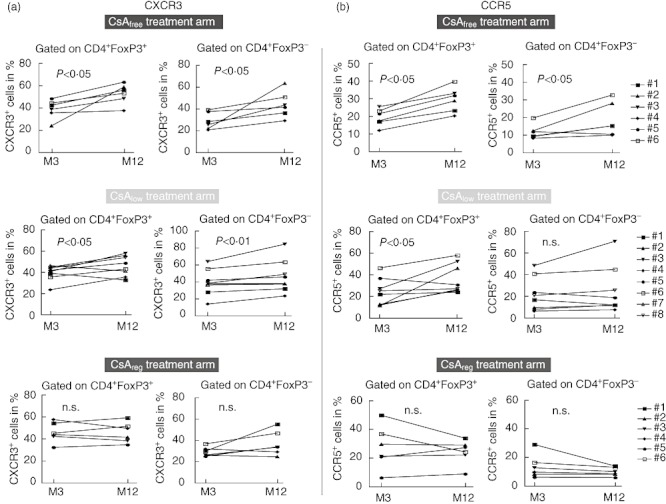
The peripheral chemokine receptors chemokine receptor 3 (CXCR3) and CC chemokine receptor 5 (CCR5) have been reported to be associated with allograft rejection. The impact of the expression of immunosuppressive drugs on peripherally circulating CD4(+) T cell subsets after renal transplantation is unknown. Expression of CXCR3 and CCR5 was investigated by flow cytometry in 20 renal allograft recipients participating in a prospective, randomized trial (NCT00514514). Initial immunosuppression consisted of basiliximab, cyclosporin A (CsA), mycophenolate sodium and corticosteroids. After 3 months, patients were treated either with CsA, mycophenolate sodium (MPA) plus corticosteroids (n = 6), CsA and everolimus plus corticosteroids (n =8) or CsA-free (CsA(free)) receiving everolimus, MPA and corticosteroids (n = 6). After initial reduction of CD4(+) forkhead box protein 3 (FoxP3)(+) and CD4(+) CD25(hi) FoxP3(+) regulatory T cells (T(regs)) (P < 0.05; P < 0.01), 3-month post-transplant percentages of T(regs) were reconstituted in CsA(free) and CsA(lo) arms compared to CsA(reg) 12 months post transplant. Expression of CCR5 and CXCR3 on CD4(+) FoxP3(+) and CD4(+) FoxP3(-) T cells 12 months post transplant was increased in CsA(free) versus CsA(reg). Increase in CCR5(+) CXCR3(+) co-expressing CD4(+) FoxP3(-) cells between 3 and 12 months correlated negatively with the glomerular filtration rate (GFR) slope/year [modification of diet in renal disease (MDRD); r = -0.59, P < 0.01]. CsA, but not everolimus, inhibits both T(reg) development and expression of CXCR3 and CCR5 on CD4(+) T cell subsets. Increase in CCR5(+) CXCR3(+) co-expressing CD4(+) FoxP3(-) T cells is associated with early loss in allograft function.
© 2012 The Authors;Clinical and Experimental Immunology © 2012 British Society for Immunology.
Figures

References
-
- Hancock WW. Chemokine receptor-dependent alloresponses. Immunol Rev. 2003;196:37–50. - PubMed
-
- Sallusto F, Baggiolini M. Chemokines and leukocyte traffic. Nat Immunol. 2008;9:949–52. - PubMed
-
- Baggiolini M. Chemokines and leukocyte traffic. Nature. 1998;392:565–8. - PubMed
-
- Melter M, Exeni A, Reinders ME, et al. Expression of the chemokine receptor CXCR3 and its ligand IP-10 during human cardiac allograft rejection. Circulation. 2001;104:2558–64. - PubMed
-
- Fahmy NM, Yamani MH, Starling RC, et al. Chemokine and receptor-gene expression during early and late acute rejection episodes in human cardiac allografts. Transplantation. 2003;75:2044–7. - PubMed
Publication types
MeSH terms
Substances
LinkOut - more resources
Full Text Sources
Other Literature Sources
Medical
Research Materials
