. 2012 Jul-Sep;9(3):327-37.
doi: 10.3109/1547691X.2012.661802. Epub 2012 Apr 4.

Aryl hydrocarbon receptor ligand effects in RBL2H3 cells

Affiliations

Aryl hydrocarbon receptor ligand effects in RBL2H3 cells

Kristina Maaetoft-Udsen et al. J Immunotoxicol. 2012 Jul-Sep.

Abstract

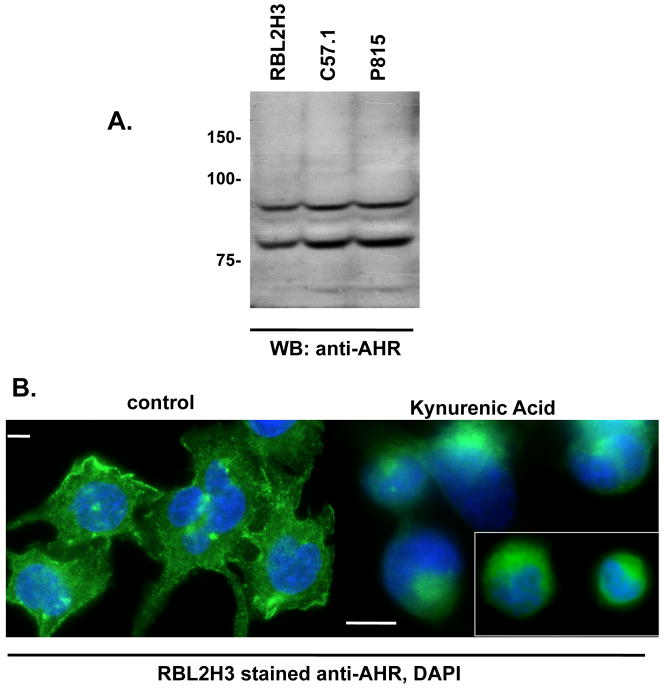
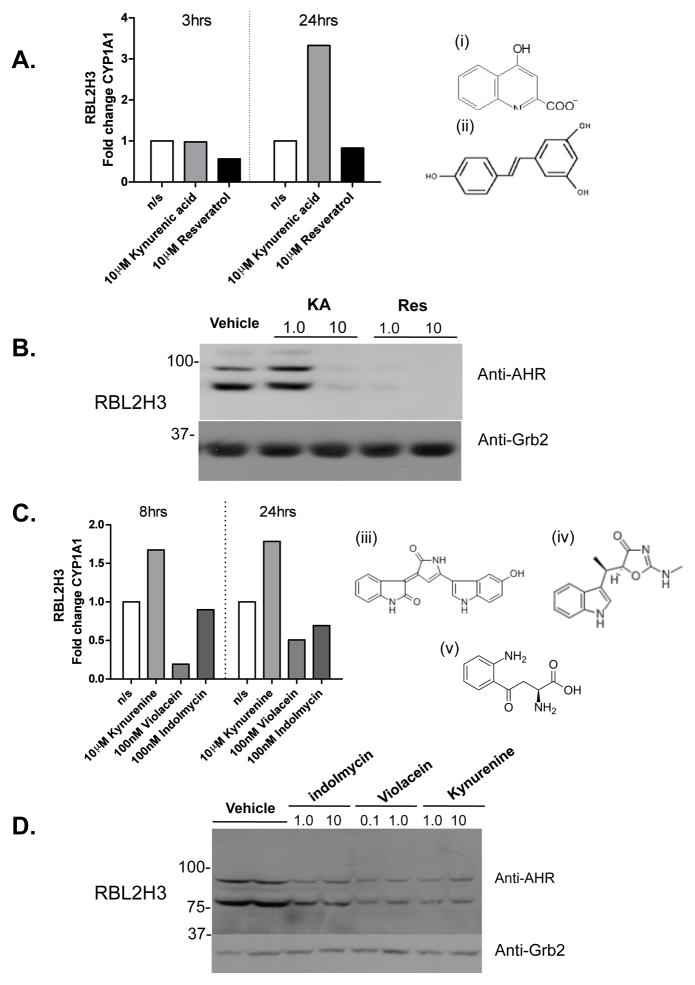
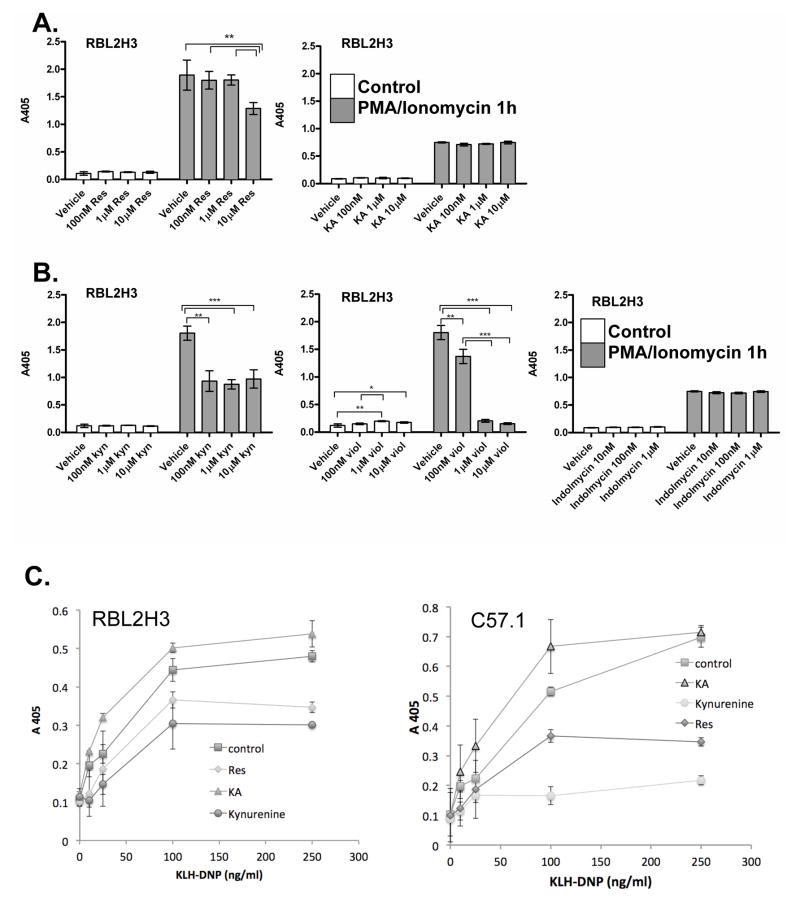
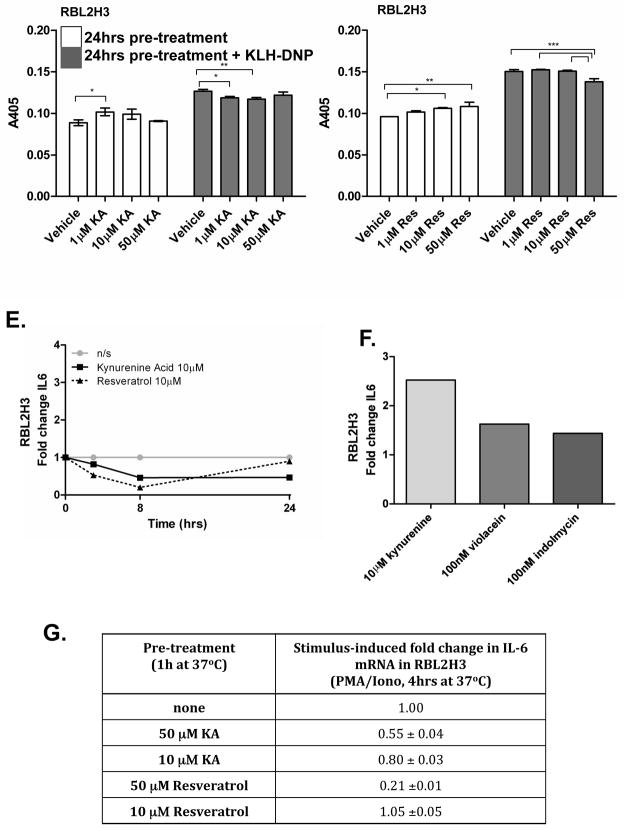
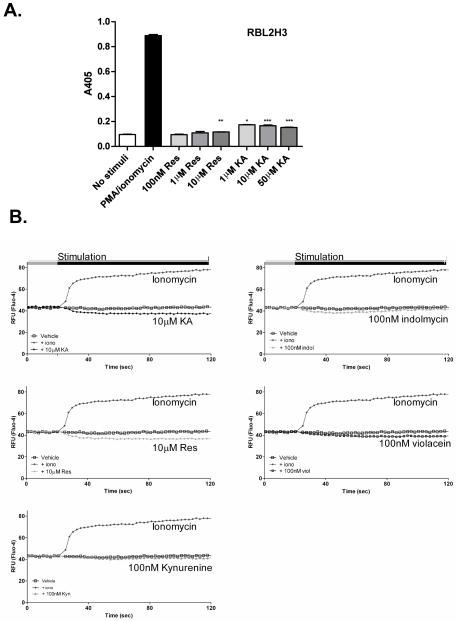
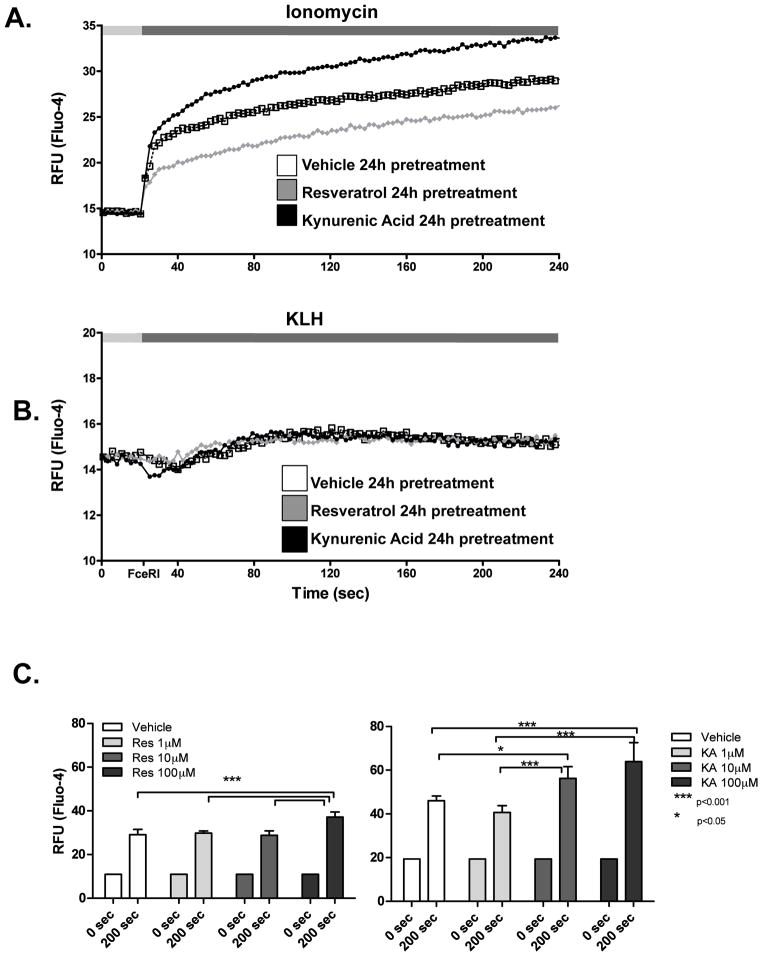
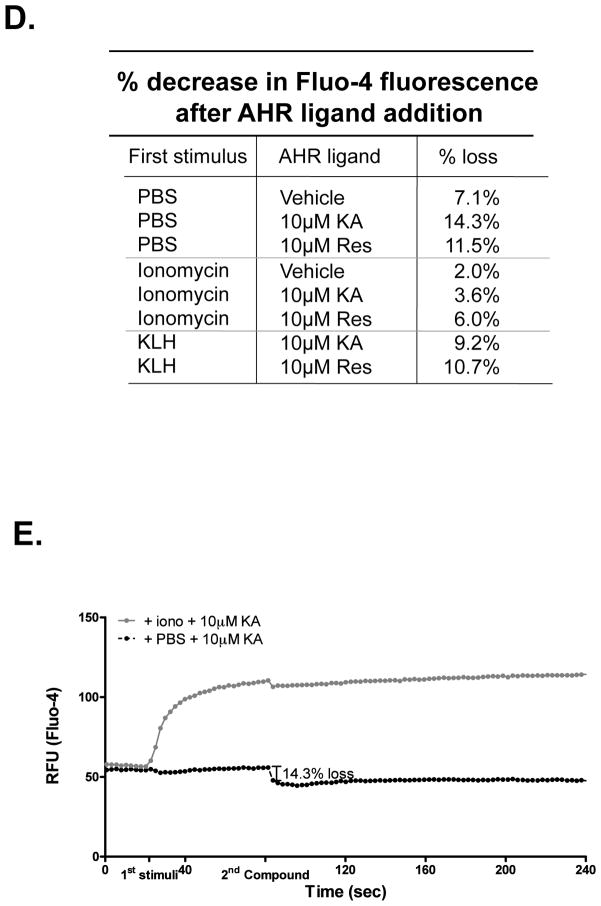
The aryl hydrocarbon receptor (AHR) mediates toxic effects of dioxin and xenobiotic metabolism. AHR has an emerging role in the immune system, but its physiological ligands and functional role in immunocytes remain poorly understood. Mast cells are immunocytes that are central to inflammatory responses and release a spectrum of pro-inflammatory mediators including histamine, mast cell proteases, and pro-inflammatory cytokines such as IL-6 upon stimulation. The aim was to investigate the AHR in model mast cells and examine how both putative and known AHR ligands, e.g., kynurenine, kynurenic acid (KA), Resveratrol, indolmycin, and violacein, affect mast cell activation and signaling. These ligands were tested on calcium signaling, degranulation, and gene expression. The data show that AHR is present in three model mast cell lines, and that various known and putative AHR ligands regulate gene expression of Cyp1a1, a gene down-stream of AHR. Furthermore, it was found that calcium influxes and mast cell secretory responses were enhanced or suppressed after chronic treatment with AHR agonists or antagonists, and that AHR ligands modified RBL2H3 cell degranulation. AHR ligands can chronically change cytokine gene expression in activated mast cells, as exemplified by IL-6. The antagonist Resveratrol repressed expression of induced IL-6 gene expression. Although KA and kynurenine are both AHR agonists, these ligands behaved differently in regards to degranulation and IL-6 expression, indicating that they may function outside of AHR pathways. These data suggest considerable complexity in RBL2H3 responses to AHR ligands, with implications for understanding of both dioxin pathology and the immunological effects of endogenous AHR ligands.


Conflict of interest statement

Declarations of Interest

The authors report no declaration of interest. The authors alone are responsible for the content of this manuscript.

Figures

Figure 1
Figure 1. Model mast cells express the AHR
(A) Lysates of RBL2H3, C57.1 and P815 were resolved by SDS-PAGE (2 × 10⁶ cells per lane). Western blot analysis was then performed with anti-AHR (0.1 μg/ml) antibody. The predicted MW of AHR is 96 kDa. (B) Immunofluorescence analysis of sub-cellular localization of AHR in untreated (left panel) and KA-treated (1 hr, 10μM, right panel) RBL2H3 cells. Scale bars are 5 μm. Inset right panel is used to show cells from a different field.
Figure 2
Figure 2. Effect of AHR ligands on CYP1A1 mRNA and AHR protein levels in RBL2H3 cells
(A) RBL2H3 were seeded at 5 × 10⁵ cells/well, grown for 16 hr, and then stimulated with 10 μM KA or Resveratrol; control wells received vehicle only. mRNA was then isolated from the cells after 3 or 24 hr of exposure and CYP1A1 transcript levels were measured by quantitative PCR; all signals were normalized to the relative expression of β-actin. Relative transcript levels were calculated using a 2−ΔΔCt method. Data shown represents one of three independent experiments. (i), (ii) Structures of KA and Resveratrol. (B) RBL-2H3 cells were treated for 72 hr with the indicated concentration (in μM) of KA or Resveratrol. Western blotting for either AHR or Grb2 (as loading control) was then performed. Figure shown is representative of one of at least three independent experiments. (C) Same experiment as in (A), but with cells harvested at 8 and 24 hr after exposure to the indicated concentrations of kynurenine, violacein, or indolmycin. Data are representative of one of three similar experiments. Structures for (iii) indolmycin, (iv) kynurenine, and (v) violacein. (D) Same experiment as in (B), but using the indicated concentrations (in μM) of kynurenine, violacein, or indolmycin. MW markers shown are in kDa.
Figure 3
Figure 3. Effects of AHR ligands on degranulation in RBL2H3 mast cells
(A) RBL2H3 cells were pre-incubated with indicated concentrations of Resveratrol or KA for 24 hr. After washing, cells were stimulated with PMA and ionomycin (1 μM each) for 30 min at 37°C. Supernatants were then harvested, incubated with p-NAG substrate solution, and β-hexoseaminidase levels measured at 405 nm (B) Degranulation from RBL2H3 cells incubated for 24 hr with putative AHR ligands, followed by stimulation with PMA and ionomycin. (C) IgE anti-DNP loaded cells (RBL2H3 or C57.1 BMMC) were pre-incubated for 1 hr with 1 μM of the indicated ligand and then stimulated with KLH-DNP. (D) RBL2H3 were pre-treated for 24 hr with the indicated AHR ligand and then degranulation in response to 200 ng KLH-DNP/ml or vehicle was measured as above. Results are shown as the mean (± SD) of experiments performed in triplicate. Data are representative of one of three similar experiments. Significant differences (*p < 0.05, **p < 0.01, ***p < 0.001) vs. vehicle treated RBL2H3 cells are indicated. (E, F, G) Induction of cytokine IL-6 gene expression after stimulation with AHR ligands. mRNA was isolated from RBL2H3 cells treated (E) with the AHR ligands KA (10 μM) or Resveratrol (10 μM) for 3, 8, and 24 hr, (F) 10 μM kynurenine, 100 nM violacein, or 100 nM indolmycin for 24 hr, or (G) pre-incubated with the indicated amount of kynurenine, violacein, or indolmycin ligand for 1 hr before being activated (pharmacologically) using PMA/Ionomycin for 4 hr, and then IL-6 transcript levels were assessed by qPCR. The data shown in table (G) were normalized to relative expression of cells stimulated with PMA/ionomycin and depicted as mean [± SD] of amplification triplicates. Relative transcript levels were calculated applying the 2−ΔΔCt method. Figures represent one of three independent experiments.
Figure 4
Figure 4. Acute calcium influx pathway is not regulated by AHR ligands in RBL2H3 cells
(A) Acute degranulation of RBL2H3 cells. RBL2H3 cells were stimulated for 30 min with Resveratrol or KA (10μM), or with PMA and ionomycin as a positive control. Degranulation (β-hexoseaminidase release) was measured at 405 nm. Results are shown as the mean (± SD) and performed in triplicate. Significant differences (*p < 0.05, **p < 0.01, ***p < 0.001) vs. non-stimulated RBL2H3 cells (one-way ANOVA with Dunnett’s test comparison) are indicated. (B) Acute stimulation of calcium influx pathway in RBL2H3 cells. A baseline fluorescence signal was acquired from Fluo-4-loaded RBL2H3 for 20 sec prior to addition of the indicated stimuli. Data were collected every 2 sec over 240 sec. All stimulations were performed in triplicate and the mean was calculated and plotted.
Figure 5
Figure 5. AHR ligands induce chronic events that modify calcium signals in RBL2H3 cells
(A, B) RBL2H3 cells were pre-incubated for 24 hr with Resveratrol or KA (10 μM). Cells were incubated with Fluo-4 and a baseline fluorescence signal was acquired for 20 sec prior to addition of the indicated stimuli (Ionomycin [A], KLH-DNP [B]). Data were then collected every 2 sec over 240 sec. All stimuli were performed in triplicate and mean was calculated and plotted; data were corrected for different start points. (C) Charts summarizing calcium changes shown in (A) as a result of increasing concentrations of Resveratrol and KA. (D, E) Effect of AHR ligands on an ongoing calcium response. Cells were incubated with Fluo-4 and a baseline fluorescence signal was acquired for 20 sec before stimuli were added; a calcium response was allowed to evolve and an addition of the indicated AHR ligand occurred at 80 sec. Example trace (mean of triplicates) is shown in (E). Figures represent one of at least two similar experiments.

References

    1. Adachi J, Mori Y, Matsui S, Matsuda T. Comparison of gene expression patterns between 2,3,7,8-tetrachlorodibenzo-p-dioxin and a natural aryl hydrocarbon receptor ligand, indirubin. Toxicol Sci. 2004;80:161–169. - PubMed
    1. Ball HJ, Yuasa HJ, Austin CJD, Weiser S, Hunt NH. Indoleamine 2,3-dioxygenase-2: A new enzyme in the kynurenine pathway. Int J Biochem Cell Biol. 2009;41:467–471. - PubMed
    1. Baolin L, Inami Y, Tanaka H, Inagaki N, Iinuma M, Nagai H. Resveratrol inhibits the release of mediators from bone marrow-derived mouse mast cells in vitro. Planta Med. 2004;70:305–309. - PubMed
    1. Beedanagari SR, Bebenek I, Bui P, Hankinson O. Resveratrol inhibits dioxin-induced expression of human CYP1A1 and CYP1B1 by inhibiting recruitment of the aryl hydrocarbon receptor complex and RNA polymerase II to the regulatory regions of the corresponding genes. Toxicol Sci. 2010;116:693–693. - PMC - PubMed
    1. DiNatale BC, Murray IA, Schroeder JC, Flaveny CA, Lahoti TS, Laurenzana EM, Omiecinski CJ, Perdew GH. Kynurenic acid is a potent endogenous aryl hydrocarbon receptor ligand that synergistically induces interleukin-6 in the presence of inflammatory signaling. Toxicol Sci. 2010a;115:89–97. - PMC - PubMed

Publication types

MeSH terms

LinkOut - more resources