. 2012 Jul;22(7):1266-81.
doi: 10.1101/gr.128876.111. Epub 2012 Apr 3.

Deep sequencing the circadian and diurnal transcriptome of Drosophila brain

Affiliations

Deep sequencing the circadian and diurnal transcriptome of Drosophila brain

Michael E Hughes et al. Genome Res. 2012 Jul.

Abstract

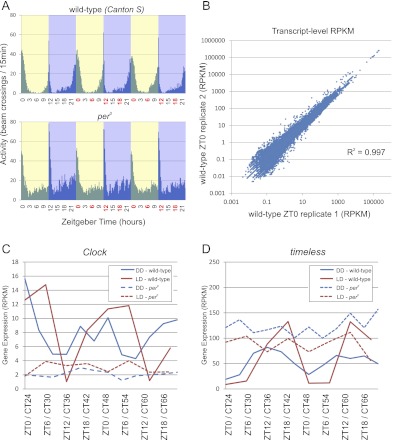
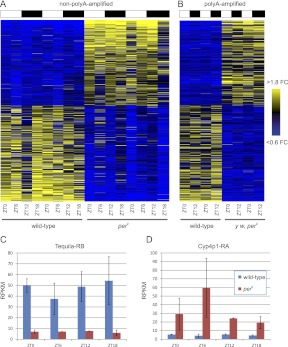
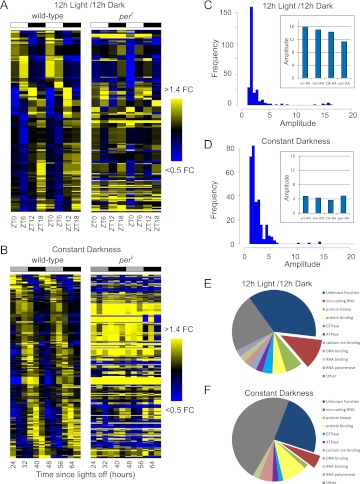
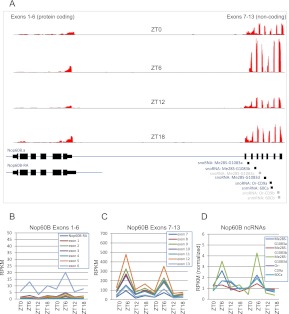
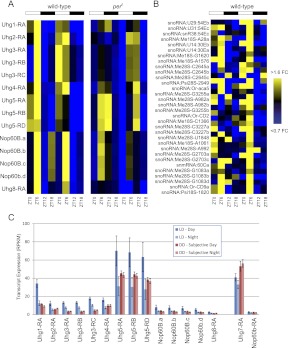
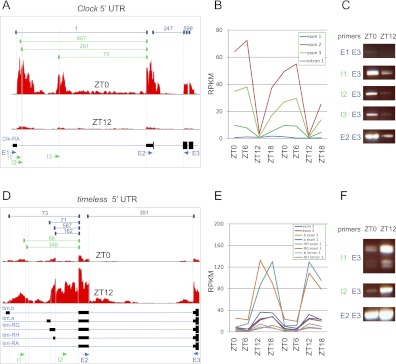
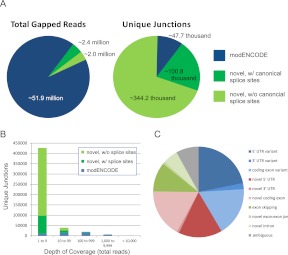
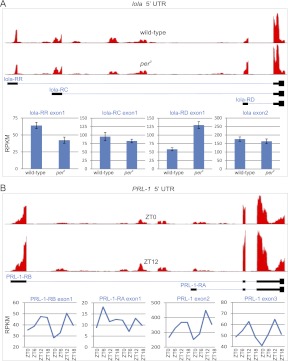
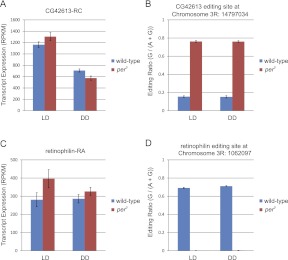
Eukaryotic circadian clocks include transcriptional/translational feedback loops that drive 24-h rhythms of transcription. These transcriptional rhythms underlie oscillations of protein abundance, thereby mediating circadian rhythms of behavior, physiology, and metabolism. Numerous studies over the last decade have used microarrays to profile circadian transcriptional rhythms in various organisms and tissues. Here we use RNA sequencing (RNA-seq) to profile the circadian transcriptome of Drosophila melanogaster brain from wild-type and period-null clock-defective animals. We identify several hundred transcripts whose abundance oscillates with 24-h periods in either constant darkness or 12 h light/dark diurnal cycles, including several noncoding RNAs (ncRNAs) that were not identified in previous microarray studies. Of particular interest are U snoRNA host genes (Uhgs), a family of diurnal cycling noncoding RNAs that encode the precursors of more than 50 box-C/D small nucleolar RNAs, key regulators of ribosomal biogenesis. Transcriptional profiling at the level of individual exons reveals alternative splice isoforms for many genes whose relative abundances are regulated by either period or circadian time, although the effect of circadian time is muted in comparison to that of period. Interestingly, period loss of function significantly alters the frequency of RNA editing at several editing sites, suggesting an unexpected link between a key circadian gene and RNA editing. We also identify tens of thousands of novel splicing events beyond those previously annotated by the modENCODE Consortium, including several that affect key circadian genes. These studies demonstrate extensive circadian control of ncRNA expression, reveal the extent of clock control of alternative splicing and RNA editing, and provide a novel, genome-wide map of splicing in Drosophila brain.


Figures

Figure 1.
Figure 1.
RNA-seq accurately measures circadian transcriptional rhythms. (A) Locomotor activity rhythms were monitored using an automated infrared beam-break apparatus in wild-type and per0 flies entrained to a 12 h:12 h light:dark (LD) environment (N = 32 flies for each experiment). Plots are histograms of beam-breaks binned at a 20-min resolution. At the times indicated in red, brains were dissected and total RNA was purified for amplification and RNA-seq analysis. (B) Raw RNA-seq reads were aligned to the reference fly genome and transcriptome using the RUM read mapping algorithm, and expression levels (presented as reads per kilobase per million reads, RPKM) were calculated. Transcript expression levels exhibit a high degree of reproducibility between biological replicates with R-squared values on the order of 0.99. Expression profiles for Clock (C) and timeless (D) show consistent patterns of circadian oscillation in wild-type brains (solid lines) as measured by RNA-seq. Period-null mutation (dashed lines) disrupts the normal circadian rhythmicity of each of these transcripts. Clock and timeless oscillate in both LD (red) and DD (blue) with expected phases, and their amplitudes are damped in DD relative to LD, also as expected. The x-axis labels show the Zeitgeber time (ZT) for LD experiments and circadian time (CT) for wild-type Canton-S flies in DD.
Figure 2.
Figure 2.
Transcripts differentially regulated by period. Two-way ANOVA was used to identify transcripts differentially regulated by per0 in both non-poly(A)- (A) and poly(A)-amplified (B) data sets. Median-normalized expression levels have been sorted by fold change (FC) (average wild-type expression in RPKM divided by average per0 expression in RPKM) and are represented as a heatmap for each transcript (vertical axis) at each time point (horizontal axis) surveyed, with yellow indicating high levels of expression, and blue, low levels. White and black bars represent light and dark, respectively, in the LD environmental regimen under which these samples were collected. The order of transcripts along the vertical axis is identical in A and B. Tequila-RB (C) and Cyp4p1-RA (D) are examples of transcripts whose expression is significantly altered between wild-type (blue) and Period loss-of-function (red). (Error bars) Mean ± standard error of the mean.
Figure 3.
Figure 3.
Twenty-four-hour transcriptional rhythms. The fold-changes (FC) of median-normalized cycling transcripts (p < 0.05, Fisher's G-test) are plotted as a heatmap for LD (A) and DD (B) samples. Transcripts are ordered by phase, as measured by JTK_Cycle. The order of transcripts along the vertical axis is identical between wild-type and per0. Distribution of amplitudes (maximum expression divided by minimum expression) of cycling transcripts for LD (C) and DD (D) samples; (inset) individual amplitudes of transcripts encoding key circadian clock components. Molecular functions as annotated in FlyBase of cycling genes are displayed as a pie chart for LD (E) and DD (F) (p < 0.05 for both JTK_Cycle and Fisher's G-test).
Figure 4.
Figure 4.
The noncoding region of Nop60B (Uhg6) oscillates with peak expression at ZT6. (A) The Nop60B.a transcript includes six protein-coding exons and seven noncoding exons ([solid black bars] exons) separated by a large intron (thin blue line). Smaller introns separating exons 7–13 are excised from Nop60B.a transcripts and processed to form mature snoRNAs and snmRNAs. (Black boxes) Mature ncRNAs expressed at detectable levels; (gray boxes) undetectable ncRNAs. (Red histograms) The depth of sequencing coverage in this region at ZT0, ZT6 (peak), ZT12, and ZT18 (trough). (B) Expression levels of Nop60B's coding exons show weak or nonexistent circadian oscillations while the noncoding exons (C) and (the median-normalized) ncRNAs they encode (D) oscillate with peak expression at ZT6.
Figure 5.
Figure 5.
Multiple Uhg-family members oscillate with peak expression during the light phase. (A) Fold-changes of median-normalized expression levels of Uhg-family members are shown as a heatmap. (White and black bars) The LD regimen under which these samples were collected. The order of transcripts along the vertical axis is identical between wild-type and per0. Note that in per0 brains, peak Uhg expression is phase-delayed by ∼6 h. (B) The fold-changes of all snoRNAs and snmRNAs encoded by Uhg genes and expressed at a detectable level are median-normalized and displayed as a heatmap. (C) Expression levels of all cycling Uhg-family members in DD are damped relative to the light phase of LD. The light phase is defined as ZT0 and ZT6 for LD samples, and CT0, CT4, and CT8 for DD samples. (Error bars) Mean ± standard error of the mean.
Figure 6.
Figure 6.
Novel transcriptional start sites in clock genes. The 5′ UTR and nearby coding exons are shown for Clock (A) and timeless (D). (Solid black bars) Exons; (thin blue lines) introns. (Red histograms) The depth of sequencing coverage at ZT0 and ZT12; (dark blue brackets, top) the number of gapped reads spanning previously annotated splice junctions; (green brackets) the number of gapped reads spanning novel splice junctions. (Arrows, bottom) PCR primers used to assay for the presence of a given splicing event, with blue indicating previously annotated and green indicating novel. (E) Exon primer; (I) intron primer. The expression levels of individual exons and introns are shown for Clock (B) and timeless (E). (C,F) rtPCR was used to detect the presence of splicing events using indicated primer pairs that span a given junction in brains of independent biological replicates collected at ZT0 and ZT12.
Figure 7.
Figure 7.
Novel splicing events in the brain transcriptome. (A) The majority of gapped reads map to previously annotated splice junctions (left); however, the vast majority of unique splice junctions detected in the brain transcriptome have not been previously annotated (right). (Blue) Splice junctions previously detected by the modENCODE Consortium (Graveley et al. 2011). (Green) Novel splice junctions with (dark green) or without (light green) canonical 5′ and 3′ acceptor/donor splice sites. (B) The depth of coverage of unique splicing events is plotted as a histogram. Not surprisingly, the more abundant a splice junction, the more likely it has been previously annotated. (C) The molecular identity of novel splicing events within ion channel genes was manually curated, with relative abundance plotted as a pie chart.
Figure 8.
Figure 8.
Examples of alternative splice isoforms regulated by per loss-of-function and time-of-day. The 5′ UTR and nearby coding exons are shown for lola (A) and PRL-1 (B). (Solid black bars) Exons; (blue lines) introns. (Red histograms, top) The depth of sequencing coverage for wild-type and per0 samples (lola) or ZT0 and ZT12 (PRL-1). Bar graphs or line graphs show the expression levels of individual exons (bottom).
Figure 9.
Figure 9.
Period alters RNA editing frequency in CG42613 and retinophilin. (A) Expression levels of CG43216-RC transcript are largely unchanged by period (B). The frequency of RNA editing in per0 is fivefold greater vs. wild-type (ANOVA, p < 5.5 × 10⁻¹¹, ANOVA, q < 5.0 × 10⁻⁹). Similar to CG42613, expression levels of retinophilin-RA transcript are not dramatically changed by period (C). The frequency of RNA editing at Chr3R:1062097 is dramatically decreased in per0 brains (ANOVA, p < 8.0 × 10⁻¹¹; ANOVA, q < 1.1 × 10⁻¹⁰) (D). (Error bars) Mean ± standard error of the mean.

Similar articles

Cited by

References

    1. Allada R, Chung BY 2010. Circadian organization of behavior and physiology in Drosophila. Annu Rev Physiol 72: 605–624 - PMC - PubMed
    1. Bass BL. 2001. RNA editing. Oxford University Press, New York.
    1. Bass BP, Cullen K, McCall K 2007. The axon guidance gene lola is required for programmed cell death in the Drosophila ovary. Dev Biol 304: 771–785 - PMC - PubMed
    1. Celniker SE, Wheeler DA, Kronmiller B, Carlson JW, Halpern A, Patel S, Adams M, Champe M, Dugan SP, Frise E, et al. 2002. Finishing a whole-genome shotgun: Release 3 of the Drosophila melanogaster euchromatic genome sequence. Genome Biol 3: research0079–0079.14 - PMC - PubMed
    1. Ceriani MF, Hogenesch JB, Yanovsky M, Panda S, Straume M, Kay SA 2002. Genome-wide expression analysis in Drosophila reveals genes controlling circadian behavior. J Neurosci 22: 9305–9319 - PMC - PubMed

Publication types

MeSH terms

Associated data