. 2012 Jun 1;72(11):2768-79.
doi: 10.1158/0008-5472.CAN-11-3567. Epub 2012 Apr 3.

CCL2 mediates cross-talk between cancer cells and stromal fibroblasts that regulates breast cancer stem cells

Affiliations

CCL2 mediates cross-talk between cancer cells and stromal fibroblasts that regulates breast cancer stem cells

Akihiro Tsuyada et al. Cancer Res. .

Abstract

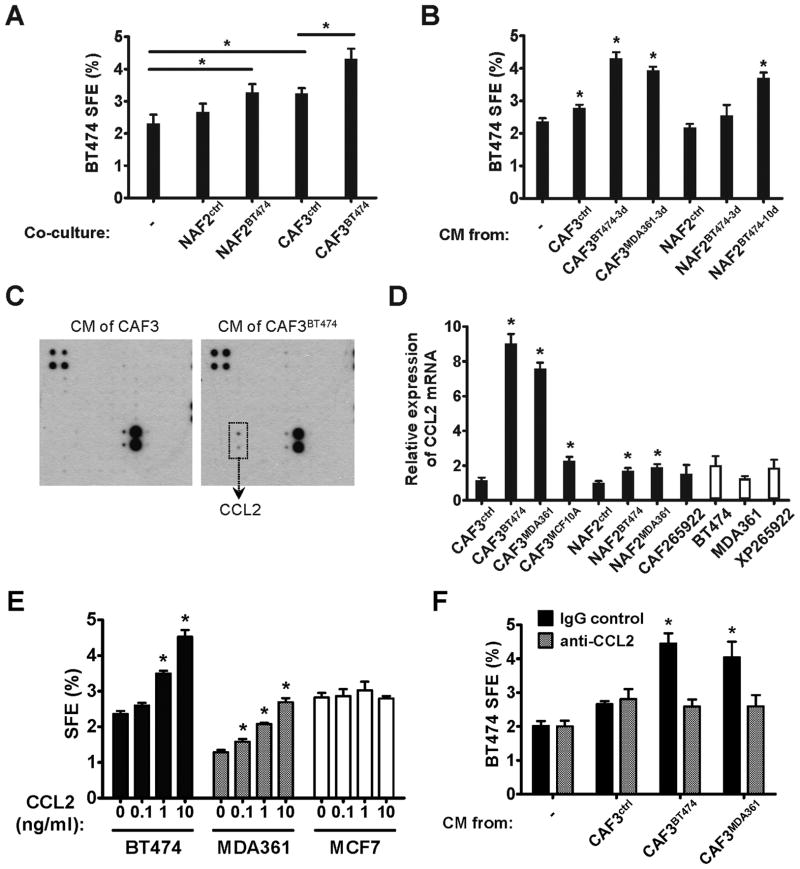
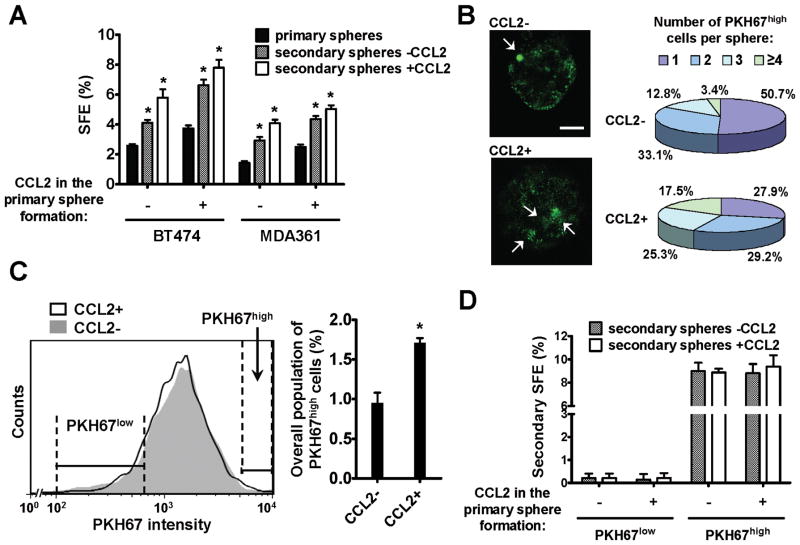
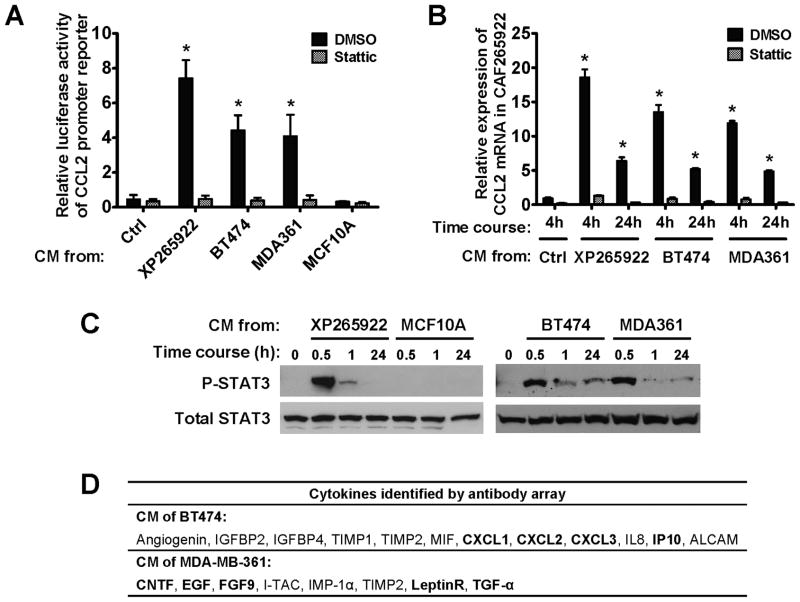
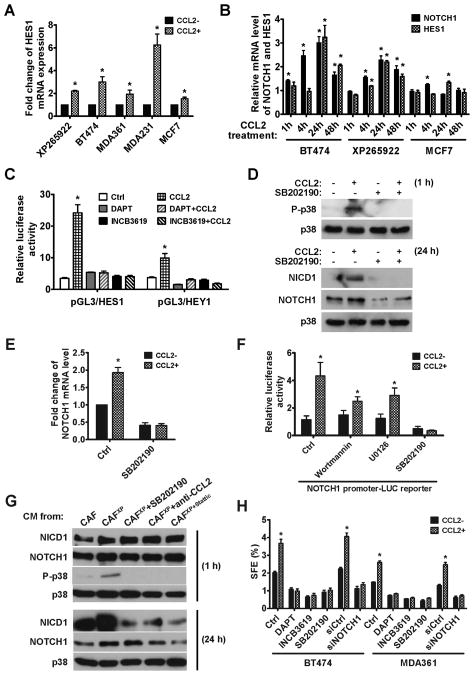
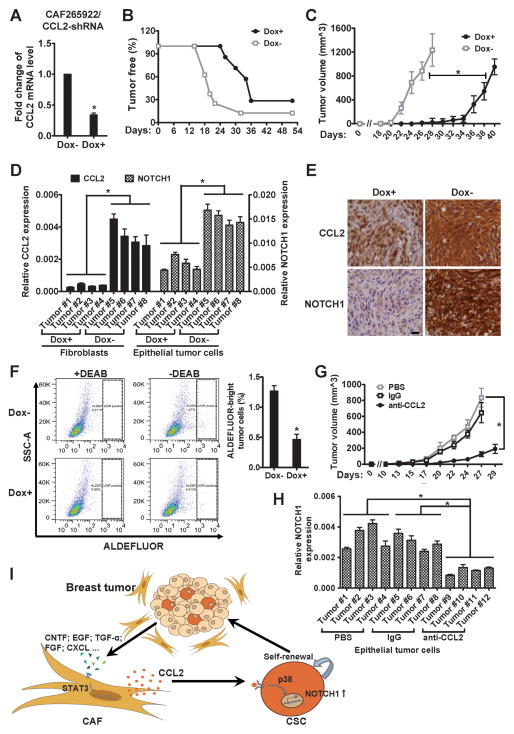
Cancer stem cells (CSC) play critical roles in cancer initiation, progression, and therapeutic refractoriness. Although many studies have focused on the genes and pathways involved in stemness, characterization of the factors in the tumor microenvironment that regulate CSCs is lacking. In this study, we investigated the effects of stromal fibroblasts on breast cancer stem cells. We found that compared with normal fibroblasts, primary cancer-associated fibroblasts (CAF) and fibroblasts activated by cocultured breast cancer cells produce higher levels of chemokine (C-C motif) ligand 2 (CCL2), which stimulates the stem cell-specific, sphere-forming phenotype in breast cancer cells and CSC self-renewal. Increased CCL2 expression in activated fibroblasts required STAT3 activation by diverse breast cancer-secreted cytokines, and in turn, induced NOTCH1 expression and the CSC features in breast cancer cells, constituting a cancer-stroma-cancer signaling circuit. In a xenograft model of paired fibroblasts and breast cancer tumor cells, loss of CCL2 significantly inhibited tumorigenesis and NOTCH1 expression. In addition, upregulation of both NOTCH1 and CCL2 was associated with poor differentiation in primary breast cancers, further supporting the observation that NOTCH1 is regulated by CCL2. Our findings therefore suggest that CCL2 represents a potential therapeutic target that can block the cancer-host communication that prompts CSC-mediated disease progression.


Conflict of interest statement

Conflict of interest: The authors have declared that no conflict of interest exists.

Figures

Fig. 1
Fig. 1. CCL2 secreted by cancer-activated fibroblasts induces mammosphere formation in BC cells
(A) Mammosphere formation assay of BT474 cells co-cultured with various fibroblasts. NAFs and CAFs were first co-cultured with BT474 cells growing in transwell inserts for 3 days (NAF2BT474 and CAF3BT474), or cultured alone (NAF2ctrl and CAF3ctrl), before being transferred to transwell inserts and co-cultured with freshly plated BT474 cells for mammosphere assays. Spheres were counted on day 10, and sphere forming efficiency (SFE) was calculated. * p<0.01. (B) Mammosphere formation assay of BT474 cells exposed to the conditioned media (CM) of differentially treated fibroblasts. Fibroblasts were first treated with BT474- or MDA361-derived CM for 3 or 10 days as indicated by “3d” or “10d” in the superscript, or with regular medium (NAF2ctrl and CAF3ctrl). Treated fibroblasts were then cultured in sphere-forming media for 24 h to prepare CM subsequently used in BT474 sphere formation assays. * p<0.01 compared to the control (the first column). (C) CM was collected from CAF3 that had been previously treated for 3 days with BT474 CM (CAF3BT474), and from untreated CAF3 as a control. Concentrated CM was subjected to a cytokine antibody array. Induction of CCL2 protein was observed in the CM of CAF3BT474. (D) Relative expression of CCL2 mRNA in various cell types was determined by RT-qPCR. CAF265922 (primary CAFs) and XP265922 (primary tumor cells) were isolated from the same BC specimen. The superscripts denote CM treatments as in (B). The time length of CM treatment was 3 days in CAF3 and 10 days in NAF2. * p<0.01 compared to the untreated control CAF3 or NAF2. (E) BT474, MDA361, and MCF7 BC cells were assayed for sphere formation in the presence of CCL2 at the indicated concentrations. * p<0.01 compared to the control (no CCL2 treatment) in each cell line. (F) Effect of CAF CM (as indicated in B) on BT474 sphere formation in the presence or absence of a CCL2 neutralizing antibody. * p<0.01 compared to the control (the first column). Each bar represents the mean ± S.D. of 3 wells.
Fig. 2
Fig. 2. CCL2 induces the self-renewing expansion of CSCs
(A) Primary and secondary sphere formation in the presence or absence of CCL2 (10 ng/ml). * p<0.01 compared to the control (the first column in each cell line). (B) Left: Confocal images of representative spheres formed by PKH67-labeled BT474 cells in the presence or absence of CCL2. PKH67high cells are indicated by arrows. Scale bar equals 20 μm. Right: Summary of the numbers of PKH67high cells per sphere by counting 150 spheres formed in the presence or absence of CCL2. (C) A representative histogram indicating the flow cytometric profile of dissociated primary sphere cells and gating of PKH67low and PKH67high cells. Percentage of PKH67high cells was summarized in the bar graph. Each bar represents the mean ± S.D. of 3 independently treated sphere cultures. * p<0.01. (D) Secondary mammosphere formation of sorted PKH67high and PKH67low primary sphere cells. Each bar represents the mean ± S.D. of 3 wells.
Fig. 3
Fig. 3. Paracrine signaling of cancer-secreted cytokines induces CCL2 production in fibroblasts via STAT3 activation
(A) A luciferase reporter containing a 2.8-kb CCL2 promoter was transfected into CAF265922 cells. Luciferase activity was analyzed at 4 h post CM exposure in the presence of DMSO or Stattic (a STAT3 inhibitor; 5 μM). Each bar represents the mean ± S.D. of 3 independently transfected wells. * p<0.01 compared to the control (the first column). (B) Total RNA isolated from CAF265922 that had been treated with CM from indicated BC cells for 4 or 24 h was analyzed for CCL2 mRNA level by RT-qPCR. Data were normalized to 18S in each sample. Each bar represents the mean ± S.D. of 3 wells. * p<0.01 compared to the control (the first column). (C) CAF265922 cells were treated with CM from indicated cells and analyzed by Western blot. (D) Summary of the cytokine array data identifying cytokines constitutively secreted by BT474 and MDA361 BC cells. Cytokines that are known to activate STAT3 are in bold.
Fig. 4
Fig. 4. CCL2 regulates CSC phenotype in BC cells by activating NOTCH signaling
(A) Total RNA isolated from various BC cell lines treated with CCL2 or vehicle for 24 h were analyzed for the expression of HES1, a target gene activated by NOTCH signaling. Data of RT-qPCR were normalized to 18S in each sample. Each bar represents the mean ± S.D. of 3 wells. * p<0.001 compared to the control (the first column). (B) Expression of NOTCH1 and HES1 mRNAs upon CCL2 treatment in the indicated time course. The mRNA level at each time point was compared to that in untreated cells, which was set as 1. Each bar represents the mean ± S.D. of 3 wells. * p<0.01 compared to untreated cells. (C) Luciferase reporters of HES1 and HEY1 were transfected into XP265922 primary BC cells. Luciferase activity was analyzed at 24 h post CCL2 treatment +/− inhibitors of γ-secretase (DAPT; 10 μM) or α-secretase (INCB3619; 5 μM). Each bar represents the mean ± S.D. of 3 independently transfected wells. * p<0.001 compared to the control (the first column). (D) Western blot analysis of p38 and NOTCH1 at indicated time points following treatment conditions in XP265922 cells. (E) Expression of NOTCH1 mRNA in XP265922 cells treated with CCL2 +/− SB202190 (5 μM) for 24 h. * p<0.001 compared to the control (the first column). (F) A luciferase reporter containing a 6-kb NOTCH1 promoter was transfected into XP265922 cells to analyze NOTCH1 promoter regulation by CCL2 and various inhibitors (Wortmannin: 1 μM; U0126: 10 μM; SB202190: 5 μM). Each bar represents the mean ± S.D. of 3 independently transfected wells. * p<0.001 compared to the control (the first column). (G) XP265922 cells were treated with CM from indicated sources and analyzed for NOTCH1 and p38 expression by Western blot. (H) Mammosphere formation assay of BC cells treated with various inhibitors in the presence or absence of CCL2. Each bar represents the mean ± S.D. of 3 wells. * p<0.01 compared to the control (the first column in each cell line).
Fig. 5
Fig. 5. Fibroblast-specific CCL2 knockdown or CCL2 depletion by neutralizing antibody inhibits in vivo tumorigenesis
(A) CAF265922 cells stably expressing Dox-inducible CCL2 shRNA were examined for CCL2 mRNA expression by RT-qPCR upon 48 h treatment of Dox (1 μg/ml) or vehicle. * p<0.001. (B) In vivo tumor formation was examined by co-transplanting unmodified XP265922 primary BC cells and the CAF265922 cells tested in (A) into the mammary fat pads of NOD/SCID/IL2Rγ-null mice, as described in Materials and Methods. The time-course of xenograft tumor formation in Dox-treated mice (Dox+) and control mice (Dox) was compared. p<0.001 between the two groups. (C) Tumor volume determined in Dox+ and Dox mice. * p<0.001 at each available time point starting from day 22. (D) Total RNA was isolated from fibroblasts and epithelial tumor cells purified from the Dox+ and Dox xenograft tumors, and subjected to RT-qPCR for CCL2 and NOTCH1 expression, respectively. * p<0.001. (E) Representative immunohistochemistry images of Dox+ and Dox xenograft tumor sections stained with antibodies against CCL2 and NOTCH1 (40×; bar=20 μm). (F) Representative flow cytometry dot plots indicating the ALDEFLUOR-bright tumor cells from Dox+ and Doxxenograft tumors. Diethylaminobenzaldehyde (DEAB), an inhibitor of ALDH, was added in the left two panels. Bar graph: Averaged percentages of the ALDEFLUOR-bright population from bulk tumor cells in 4 Dox+ and 4 Dox xenograft tumors. * p<0.001. (G) Tumor volume determined in mice treated with PBS, IgG, or CCL2 neutralizing antibody. * p<0.001. (H) Total RNA was isolated from epithelial tumor cells purified from the three groups of xenograft tumors, and subjected to RT-qPCR for NOTCH1 expression. * p<0.001. (I) A model of the CSC-stimulating crosstalk circuit that involves STAT3, CCL2 and NOTCH pathways. In the tumor microenvironment, paracrine signaling initiated by BC cells induces CCL2 production by stromal fibroblasts through STAT3 activation, and the fibroblast-derived CCL2, in turn, promotes cancer progression by regulating CSCs through activation of the NOTCH pathway.

Comment in

References

    1. Visvader JE, Lindeman GJ. Cancer stem cells in solid tumours: accumulating evidence and unresolved questions. Nat Rev Cancer. 2008;8(10):755–68. - PubMed
    1. Ailles LE, Weissman IL. Cancer stem cells in solid tumors. Curr Opin Biotechnol. 2007;18(5):460–6. - PubMed
    1. Kalluri R, Zeisberg M. Fibroblasts in cancer. Nat Rev Cancer. 2006;6(5):392–401. - PubMed
    1. Kuperwasser C, Chavarria T, Wu M, et al. Reconstruction of functionally normal and malignant human breast tissues in mice. Proc Natl Acad Sci U S A. 2004;101(14):4966–71. - PMC - PubMed
    1. Melgarejo E, Medina MA, Sanchez-Jimenez F, Urdiales JL. Monocyte chemoattractant protein-1: a key mediator in inflammatory processes. Int J Biochem Cell Biol. 2009;41(5):998–1001. - PubMed

Publication types