. 2012 Apr 2;197(1):141-60.
doi: 10.1083/jcb.201111049.

Multivariate proteomic profiling identifies novel accessory proteins of coated vesicles

Affiliations

Multivariate proteomic profiling identifies novel accessory proteins of coated vesicles

Georg H H Borner et al. J Cell Biol. .

Abstract

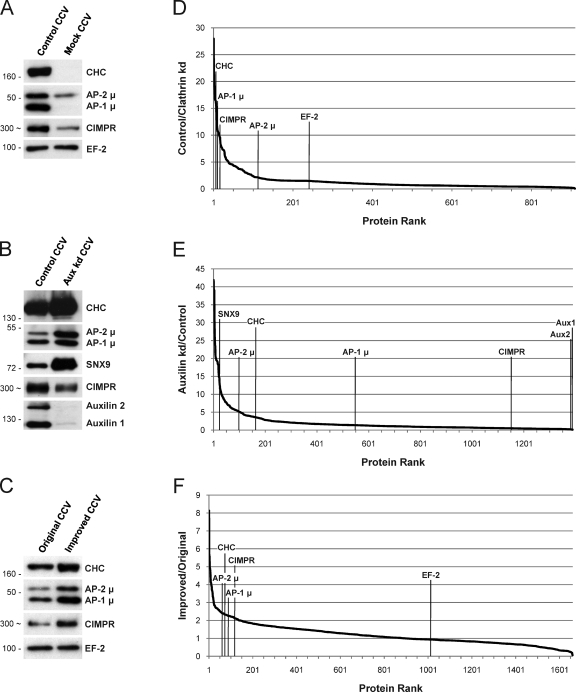
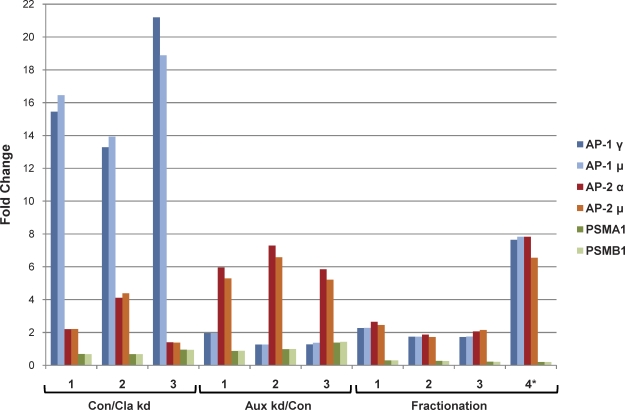
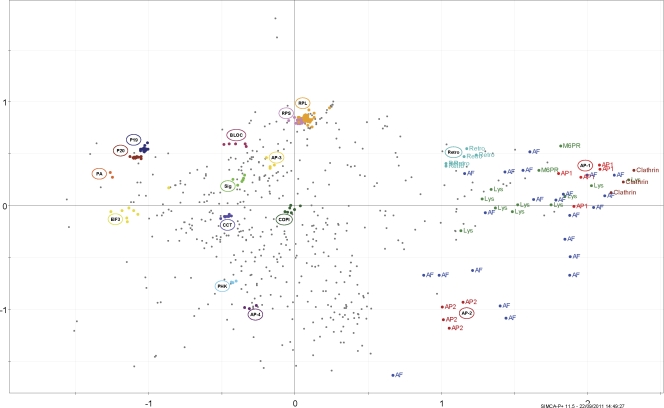
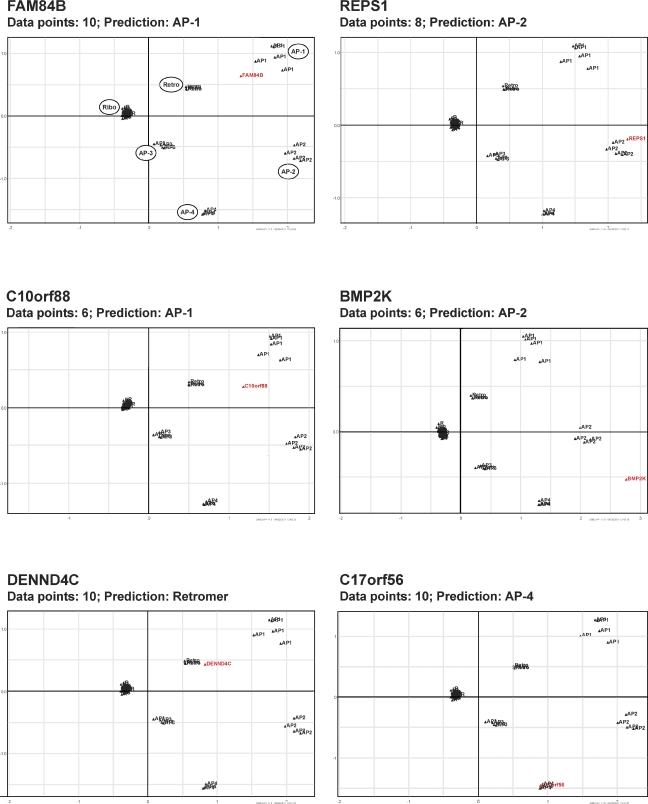
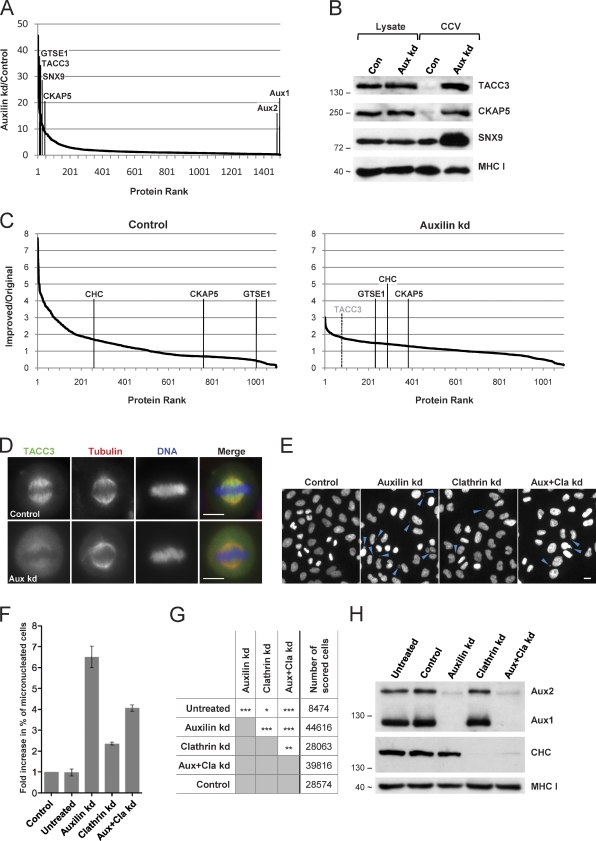
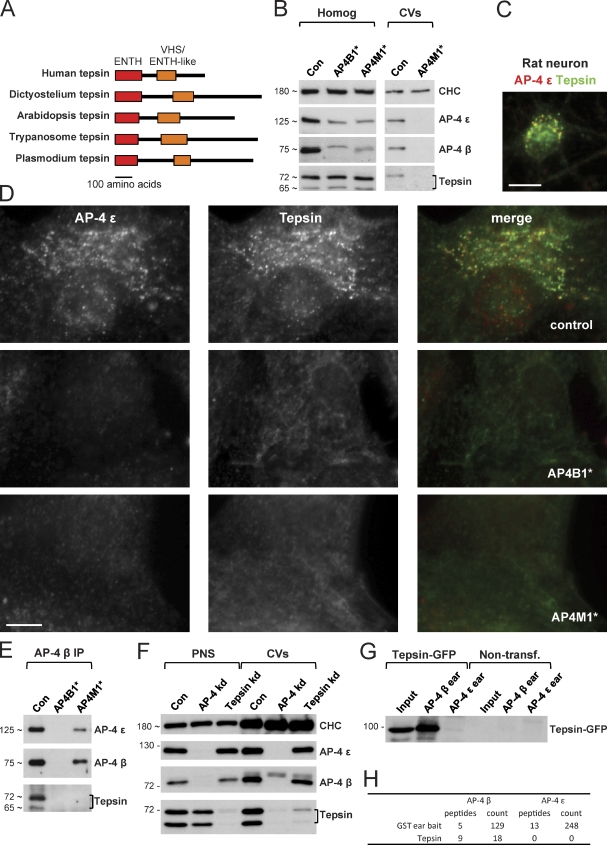
Despite recent advances in mass spectrometry, proteomic characterization of transport vesicles remains challenging. Here, we describe a multivariate proteomics approach to analyzing clathrin-coated vesicles (CCVs) from HeLa cells. siRNA knockdown of coat components and different fractionation protocols were used to obtain modified coated vesicle-enriched fractions, which were compared by stable isotope labeling of amino acids in cell culture (SILAC)-based quantitative mass spectrometry. 10 datasets were combined through principal component analysis into a "profiling" cluster analysis. Overall, 136 CCV-associated proteins were predicted, including 36 new proteins. The method identified >93% of established CCV coat proteins and assigned >91% correctly to intracellular or endocytic CCVs. Furthermore, the profiling analysis extends to less well characterized types of coated vesicles, and we identify and characterize the first AP-4 accessory protein, which we have named tepsin. Finally, our data explain how sequestration of TACC3 in cytosolic clathrin cages causes the severe mitotic defects observed in auxilin-depleted cells. The profiling approach can be adapted to address related cell and systems biological questions.


Figures

Figure 1.
Figure 1.
Three unbiased criteria to identify CCV proteins. (A–C) Western blots of CCV fractions. (D–F) Corresponding proteomic analyses by SILAC and quantitative mass spectrometry. The ratio of depletion or enrichment (fold change) was calculated for each protein, and proteins were ranked from the highest to the lowest ratio. (A and D) Control CCV fractions compared with mock CCV fractions prepared from clathrin-depleted cells. Genuine CCV proteins (AP-1, AP-2, and CIMPR) are depleted from the mock fraction; contaminants (EF-2) are unchanged. The apparent depletion is more pronounced for AP-1 than for AP-2. (B and E) CCV/cage fractions from auxilin-depleted cells, which accumulate membraneless clathrin cages, compared with control CCV fractions. Endocytic proteins (AP-2 and SNX9) are enriched in the cages, whereas transmembrane cargo proteins (CIMPR) are depleted. (C and F) Improved CCV preparation compared with original preparation. CCV proteins are enriched approximately twofold in the improved CCV fraction (see also Fig. S1). To exclude the possibility that any of the changes were caused by altered transcriptional regulation, we performed a comprehensive microarray gene expression analysis (Fig. S2). Positions of protein molecular mass markers are indicated in kilodaltons in A–C. In some cases, the apparent protein molecular weight is shown instead (indicated by ∼); this was estimated from the average migration of the protein relative to molecular weight markers on at least three gels.
Figure 2.
Figure 2.
CCV proteins and contaminants have distinct profiles. The fold changes of selected CCV proteins (AP-1 and AP-2 subunits) and copurifying proteasomal contaminants (PSMA1 and PSMB1) are shown for 10 SILAC datasets. Proteins that are subunits of the same protein complex have closely correlated profiles. Con/Cla kd 1–3: Triplicate repeats of control versus clathrin-depleted. Aux kd/Con 1–3: Triplicate repeats of auxilin-depleted versus control. Fractionation 1–3: Triplicate repeats of improved versus original CCV preparation. Fractionation 4*: A further comparison based on fractionation properties of CCVs (see Fig. S1, D and E).
Figure 3.
Figure 3.
PCA reveals clustering of CCV and non-CCV proteins into functional groups. The SILAC data were decorrelated by PCA. The figure shows the projections of the data on the first (x axis) and second (y axis) principal components (scores plot). Each scatter point represents a protein. Distance from the origin of the plot indicates how strongly a protein is affected under the experimental conditions. Close proximity of proteins indicates similar profiles. Only the 688 proteins common to all 10 SILAC sets were analyzed. Subunits of a known protein complex are shown in the same color. Clathrin heavy and light chains, AP-1, and AP-2 form distinct clusters that and are clearly separated from the bulk of the other proteins. Known CCV coat proteins are annotated as AF (accessory factors). Mannose 6-phopshate receptors (M6PR) and lysosomal enzymes (Lys) are established cargo molecules of intracellular CCVs. A fully annotated version of this plot is shown in Fig. S3. Retro, retromer; RPS and RPL, small and large ribosomal subunits; COPI, COPI coat; CCT, CCT chaperone; Sig, signalosome; BLOC, BLOC-1; EIF3, translation initiation factor 3; PHK, phosphorylase kinase. P19, P20, PA: 19S, 20S, and 11S subcomplexes of the proteasome.
Figure 4.
Figure 4.
Automated PCA of sample CCV proteins. Automated PCA was performed in the context of a reference set (85 proteins belonging to six protein complexes: AP-1, AP-2, AP-3, AP-4, retromer, and ribosomes; Table S1). For each candidate protein, PCA of the reference set was performed using only those datasets in which the candidate protein was represented. The candidate protein was then projected onto the corresponding PCA plot, and the nearest reference cluster was determined. The figure shows the projections on the first two principal components for six sample proteins. The relative positions of reference clusters change with different combinations of available data, but in each case, all reference proteins are correctly grouped into the expected complexes. Candidate proteins are shown in red and reference proteins in black.
Figure 5.
Figure 5.
Subcellular localization of predicted new CCV, retromer, and AP-4–associated proteins. The proteins shown in Fig. 4 were localized by immunofluorescence microscopy. In the case of REPS1, the endogenous protein was detected with a specific antibody. Other proteins were myc- or GFP-tagged as indicated, and transiently expressed. Colocalization with intracellular or plasma membrane clathrin-coated structures was investigated by double labeling with antibodies against AP-1 γ or AP-2 α, respectively. C10orf88-myc colocalizes with AP-1 and AP-2, which necessitated imaging in two different focal plains. For reasons of antibody compatibility, CALM was used in this case to define clathrin-coated structures at the plasma membrane. Overlays show new proteins in red and reference proteins in green. Bars: (large panels) 10 µm; (insets) 2 µm.
Figure 6.
Figure 6.
Estimated stoichiometry of clathrin coats. To estimate the abundance of major CCV proteins in the CCV fraction, emPAIs were calculated from the SILAC data (Table S1) and normalized to CHC (relative emPAI = 1). The approximate number of copies of each protein in a “typical” CCV with 40 triskelia (Cheng et al., 2007) is also indicated. Error bars indicate SD (n = 3). (A) Relative abundance of APs and clathrin. For every CHC molecule, there are ∼0.3 light chains (CLT A + B) and ∼0.3 AP complexes. AP-1 is approximately twice as abundant as AP-2, which suggests that ∼2/3 of the CCVs in the preparation are intracellular, and ∼1/3 are endocytic. (B) Estimated composition of the intracellular CCV coat, assuming a CHC/AP-1 ratio of ∼3:1. There may be more than one type of intracellular CCV; the figure shows the estimates for a hypothetical average CCV. (C) Estimated composition of the endocytic CCV coat, assuming a CHC/AP-2 ratio of ∼3:1. Asterisks indicate shared proteins.
Figure 7.
Figure 7.
Auxilin depletion causes sequestration of mitotic spindle proteins in clathrin cages. (A) Representative SILAC analysis of CCV fractions from control and auxilin-depleted cells, as performed in Fig. 1 E. The ranks of TACC3, GTSE1, and CKAP5 are indicated. (B) Western blot of whole cell lysates and CCV fractions corresponding to A. TACC3 and CKAP5 are barely detectable in control CCV fractions but highly enriched in CCV fractions from auxilin-depleted cells. In contrast, typical CCV proteins such as SNX9 are readily detectable in control CCVs. MHC-I is shown as a loading control. (C) Fractionation behavior of CKAP5, TACC3, and GTSE1 in control (left) and auxilin-depleted cells (right). In both cases, fractions were prepared using the original or the improved protocol, and compared by SILAC as in Fig. 1 F. CKAP5, GTSE1, and TACC3 (which was undetectable under control conditions) fractionate like clathrin-associated proteins only in auxilin-depleted cells, which indicates a specific association with clathrin cages. (D) Auxilin depletion causes loss of TACC3 from the mitotic spindle in HeLa cells. Bars, 10 µm. (E) HeLa cells were depleted of auxilin, clathrin, or both, or treated with a nontargeting siRNA (control), then stained with Hoechst to visualize DNA. Micronuclei (arrowheads) were detected by automated microscopy. Representative images are shown. Bar, 20 µm. (F) Relative changes in the proportion of micronucleated cells, normalized to nontargeting siRNA-treated cells (control). Error bars show the SEM of four independent repeats (three repeats for untreated cells). (G) Binary comparisons of the treatment groups shown in F, using ANOVA and the post-hoc Tukey-Kramer significance test. The difference between auxilin depletion and combined clathrin/auxilin depletion is highly significant (P < 0.001). The total number of cells scored for every condition is indicated. *, P < 0.05; **, P < 0.01; ***, P < 0.001. (H) Corresponding Western blot analysis of cell lysates. Clathrin and auxilin (isoforms 1 and 2) were effectively depleted in the individual and the combined knockdowns. Positions of protein molecular mass markers are indicated in kilodaltons in B and H. In some cases, the apparent protein molecular weight is shown instead (indicated by ∼); this was estimated from the average migration of the protein relative to molecular weight markers on at least three gels.
Figure 8.
Figure 8.
Characterization of tepsin, a new AP-4–associated protein. (A) Schematic diagrams of tepsin from organisms belonging to all five eukaryotic supergroups. All tepsins have an N-terminal ENTH domain and a central VHS/ENTH-like domain. (B) Western blots of whole cell lysates and coated vesicle (CV) fractions from primary human fibroblasts. Tepsin has two isoforms. Although the total amount of tepsin is unchanged in cells with mutations in the AP-4 β and μ subunits (AP4B1* and AP4M1*, respectively), the tepsin no longer co-fractionates with coated vesicles. (C) Immunofluorescence double labeling for tepsin and the AP-4 ε subunit in a primary cortical rat neuron. The two proteins show extensive colocalization. Bar, 10 µm. (D) Immunofluorescence double labeling for tepsin and AP-4 ε in primary human fibroblasts. Although the two proteins colocalize in a punctate perinuclear pattern in control cells, this pattern is absent in AP-4–deficient cells. Bar, 10 µm. (E) Western blots of immunoprecipitates of the AP-4 β subunit from extracts of control and AP-4–deficient fibroblasts, probed for AP-4 subunits and tepsin. Tepsin coimmunoprecipitates with AP-4 only in the control extracts. (F) PNS and coated vesicle fraction from control, AP-4–depleted, and tepsin-depleted HeLa cells. Although tepsin requires AP-4 for incorporation into coated vesicles, AP-4 can still be incorporated in the absence of tepsin. (G) GST pull-downs from tepsin-GFP–expressing HeLa cells. Tagged tepsin specifically interacts with the AP-4 β “ear” domain. (H) GST pull-downs from HeLa cells were analyzed by mass spectrometry. Peptides, unique matched peptides; count, total number of matched peptides. Tepsin is only pulled down with the AP-4 β ear. Positions of protein molecular mass markers are indicated in kilodaltons in B and E–G. In some cases, the apparent protein molecular weight is shown instead (indicated by ∼); this was estimated from the average migration of the protein relative to molecular weight markers on at least three gels.

References

    1. Abou Jamra R., Philippe O., Raas-Rothschild A., Eck S.H., Graf E., Buchert R., Borck G., Ekici A., Brockschmidt F.F., Nöthen M.M., et al. 2011. Adaptor protein complex 4 deficiency causes severe autosomal-recessive intellectual disability, progressive spastic paraplegia, shy character, and short stature. Am. J. Hum. Genet. 88:788–795 10.1016/j.ajhg.2011.04.019 - DOI - PMC - PubMed
    1. Antrobus R., Borner G.H. 2011. Improved elution conditions for native co-immunoprecipitation. PLoS ONE. 6:e18218 10.1371/journal.pone.0018218 - DOI - PMC - PubMed
    1. Bergeron J.J., Au C.E., Desjardins M., McPherson P.S., Nilsson T. 2010. Cell biology through proteomics—ad astra per alia porci. Trends Cell Biol. 20:337–345 10.1016/j.tcb.2010.02.005 - DOI - PubMed
    1. Blondeau F., Ritter B., Allaire P.D., Wasiak S., Girard M., Hussain N.K., Angers A., Legendre-Guillemin V., Roy L., Boismenu D., et al. 2004. Tandem MS analysis of brain clathrin-coated vesicles reveals their critical involvement in synaptic vesicle recycling. Proc. Natl. Acad. Sci. USA. 101:3833–3838 10.1073/pnas.0308186101 - DOI - PMC - PubMed
    1. Booth D.G., Hood F.E., Prior I.A., Royle S.J. 2011. A TACC3/ch-TOG/clathrin complex stabilises kinetochore fibres by inter-microtubule bridging. EMBO J. 30:906–919 10.1038/emboj.2011.15 - DOI - PMC - PubMed

Publication types

Substances