

Neuroimmune semaphorin 4A downregulates the severity of allergic response
- PMID: 22472774
- PMCID: PMC3378810
- DOI: 10.1038/mi.2012.18
Neuroimmune semaphorin 4A downregulates the severity of allergic response
Abstract
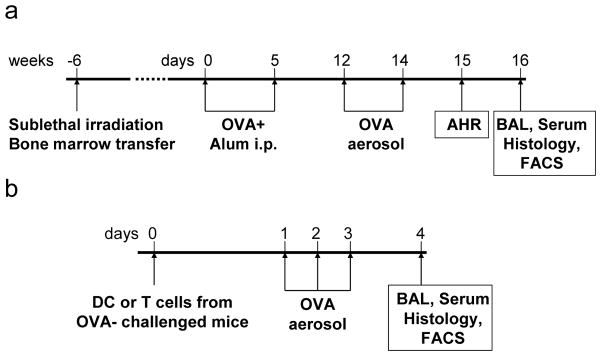
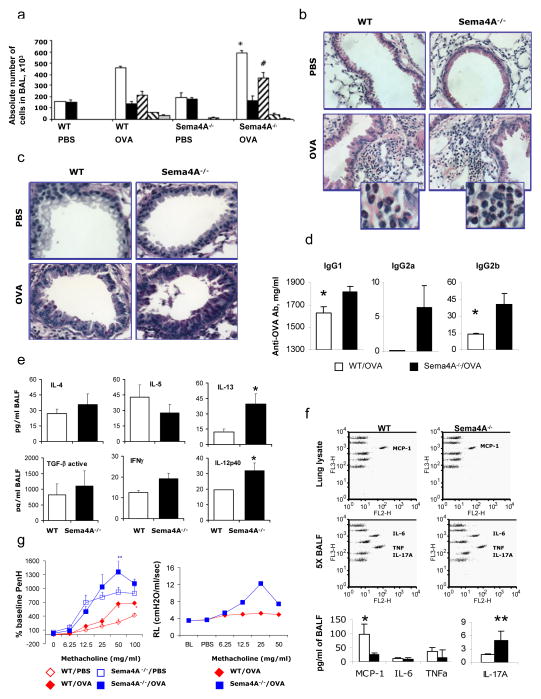
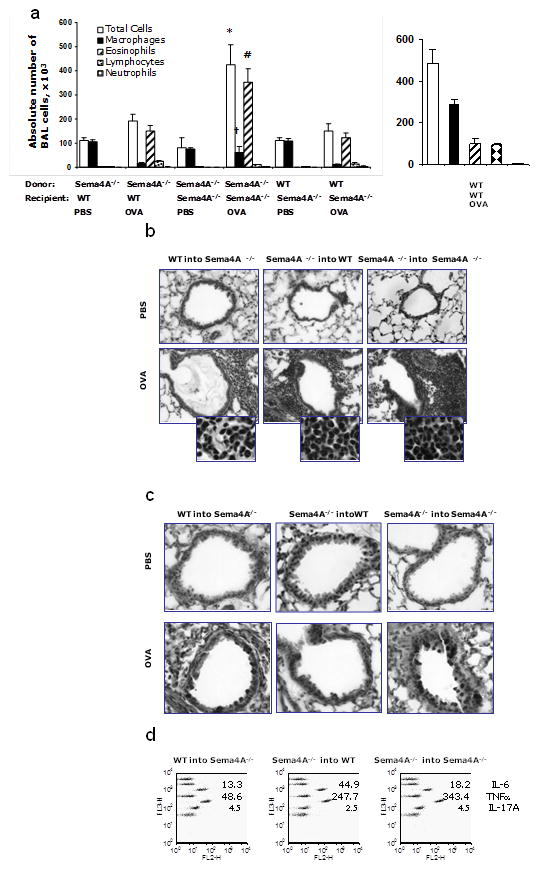
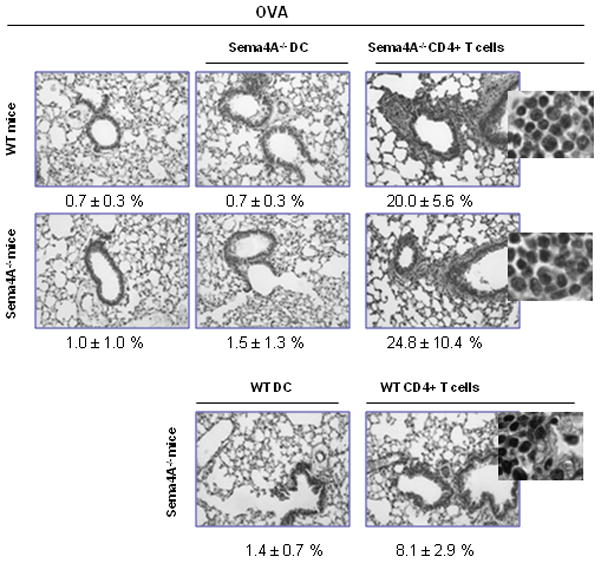
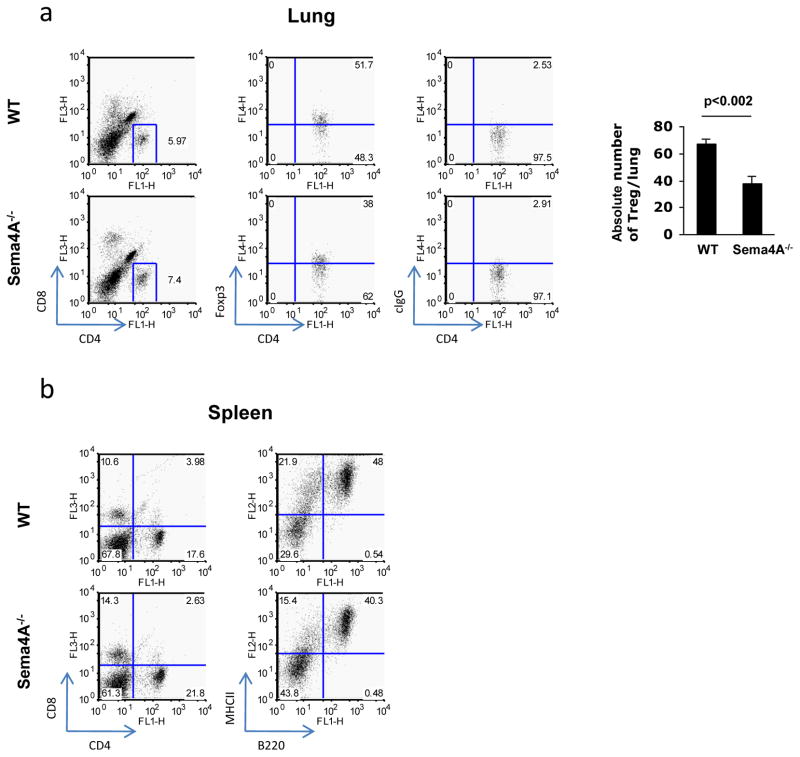
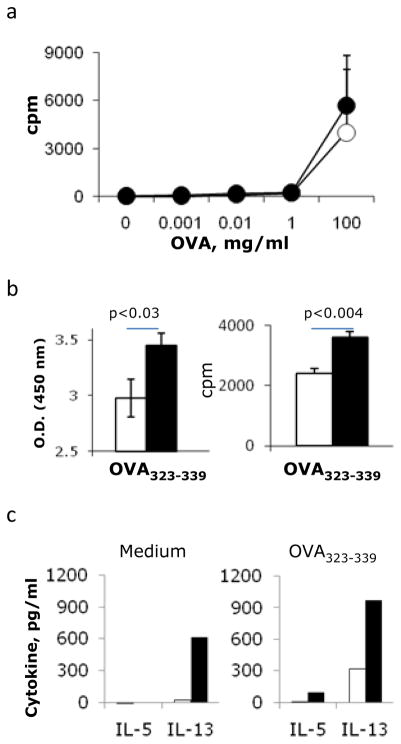
To define the role of semaphorin 4A (Sema4A) in allergic response, we employed Sema4A⁻/⁻ and wild-type (WT) mice in the experimental model of ovalbumin (OVA)-induced allergic airway inflammation. We observed a selective increase in eosinophilic airway infiltration accompanied by bronchial epithelial cell hyperplasia in allergen-treated Sema4A⁻/⁻ mice relative to WT mice. This enhanced inflammatory response was associated with a selective increase in bronchoalveolar lavage (BAL) interleukin 13 (IL-13) content, augmented airway hyperreactivity, and lower regulatory T cell (Treg) numbers. In vivo allergen-primed Sema4A⁻/⁻ CD4+ T cells were more effective in transferring T helper type 2 (Th2) response to naive mice as compared with WT CD4+ T cells. T-cell proliferation and IL-13 productions in OVA₃₂₃₋₃₃₉-restimulated Sema4A⁻/⁻ cell cultures were upregulated. Generated bone marrow chimeras showed an equal importance of both lung-resident cell and inflammatory cell Sema4A expression in optimal disease regulation. These data provide a new insight into Sema4A biology and define Sema4A as an important regulator of Th2-driven lung pathophysiology.
Conflict of interest statement
The authors declared no conflict of interest
Figures
Similar articles
-
Neuroimmune semaphorin 4D is necessary for optimal lung allergic inflammation.Mol Immunol. 2013 Dec;56(4):480-7. doi: 10.1016/j.molimm.2013.05.228. Epub 2013 Aug 1. Mol Immunol. 2013. PMID: 23911404 Free PMC article.
-
Expression of neuroimmune semaphorins 4A and 4D and their receptors in the lung is enhanced by allergen and vascular endothelial growth factor.BMC Immunol. 2011 May 19;12:30. doi: 10.1186/1471-2172-12-30. BMC Immunol. 2011. PMID: 21595947 Free PMC article.
-
An inhibitory role for Sema4A in antigen-specific allergic asthma.J Clin Immunol. 2013 Jan;33(1):200-9. doi: 10.1007/s10875-012-9798-5. Epub 2012 Sep 25. J Clin Immunol. 2013. PMID: 23007237
-
Neuroimmune semaphorin 4A as a drug and drug target for asthma.Int Immunopharmacol. 2013 Nov;17(3):568-75. doi: 10.1016/j.intimp.2013.08.005. Epub 2013 Aug 28. Int Immunopharmacol. 2013. PMID: 23994348 Free PMC article.
-
Neuroimmune Semaphorin 4A in Cancer Angiogenesis and Inflammation: A Promoter or a Suppressor?Int J Mol Sci. 2018 Dec 30;20(1):124. doi: 10.3390/ijms20010124. Int J Mol Sci. 2018. PMID: 30598022 Free PMC article. Review.
Cited by
-
Comparison of the efficacy of combined budesonide and fexofenadine versus combined fluticasone propionate and fexofenadine on the expression of class-4 semaphorins and their receptors in the peripheral blood cells of patients with allergic rhinitis.Heliyon. 2023 Nov 28;10(1):e22924. doi: 10.1016/j.heliyon.2023.e22924. eCollection 2024 Jan 15. Heliyon. 2023. PMID: 38148815 Free PMC article.
-
Human airway smooth muscle cell proliferation from asthmatics is negatively regulated by semaphorin3A.Oncotarget. 2016 Dec 6;7(49):80238-80251. doi: 10.18632/oncotarget.12884. Oncotarget. 2016. PMID: 27791986 Free PMC article.
-
Cytokines in chronic respiratory diseases.F1000 Biol Rep. 2013;5:3. doi: 10.3410/B5-3. Epub 2013 Feb 1. F1000 Biol Rep. 2013. PMID: 23413371 Free PMC article.
-
Transmembrane semaphorins: Multimodal signaling cues in development and cancer.Cell Adh Migr. 2016 Nov;10(6):675-691. doi: 10.1080/19336918.2016.1197479. Epub 2016 Jun 13. Cell Adh Migr. 2016. PMID: 27295627 Free PMC article. Review.
-
Semaphorin4A-Plexin D1 Axis Induces Th2 and Th17 While Represses Th1 Skewing in an Autocrine Manner.Int J Mol Sci. 2020 Sep 22;21(18):6965. doi: 10.3390/ijms21186965. Int J Mol Sci. 2020. PMID: 32971928 Free PMC article.
References
-
- Fuhlbrigge AL, et al. The burden of asthma in the United States: level and distribution are dependent on interpretation of the national asthma education and prevention program guidelines. Am J Respir Crit Care Med. 2002;166:1044–1049. - PubMed
-
- Eder W, Ege MJ, von Mutius E. The asthma epidemic. N Engl J Med. 2006;355:2226–2235. - PubMed
-
- Cohn L, Elias JA, Chupp GL. Asthma: mechanisms of disease persistence and progression. Annu Rev Immunol. 2004;22:789–815. - PubMed
-
- Borger P, Tamm M, Black JL, Roth M. Asthma: is it due to an abnormal airway smooth muscle cell? Am J Respir Crit Care Med. 2006;174:367–72. - PubMed
Publication types
MeSH terms
Substances
Grants and funding
LinkOut - more resources
Full Text Sources
Other Literature Sources
Molecular Biology Databases
Research Materials
