pPKCα mediated-HIF-1α activation related to the morphological modifications occurring in neonatal myocardial tissue in response to severe and mild hyperoxia
- PMID: 22472890
- PMCID: PMC3352131
- DOI: 10.4081/ejh.2012.e2
pPKCα mediated-HIF-1α activation related to the morphological modifications occurring in neonatal myocardial tissue in response to severe and mild hyperoxia
Abstract
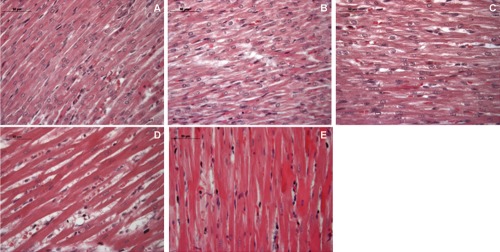
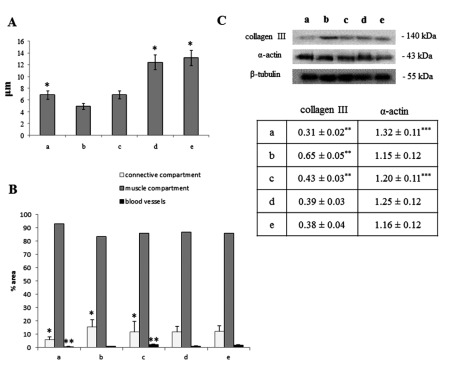
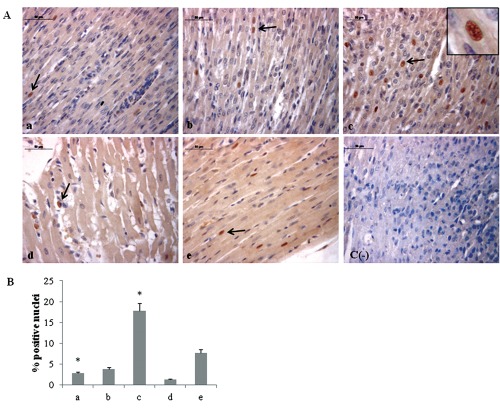
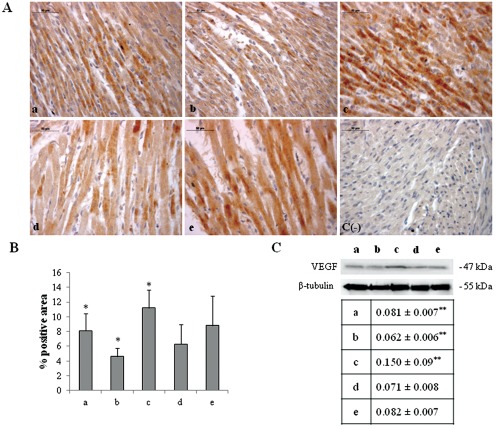
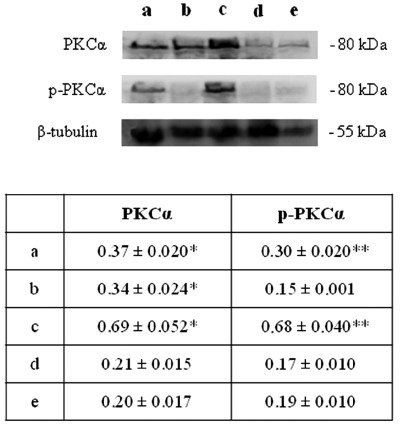
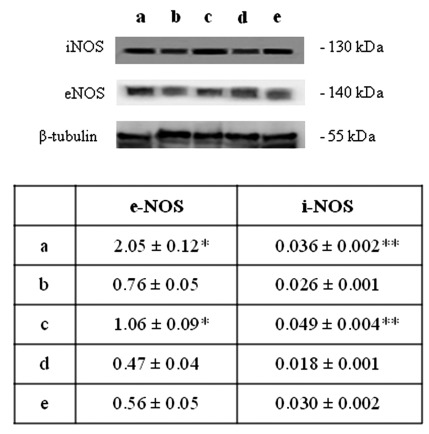
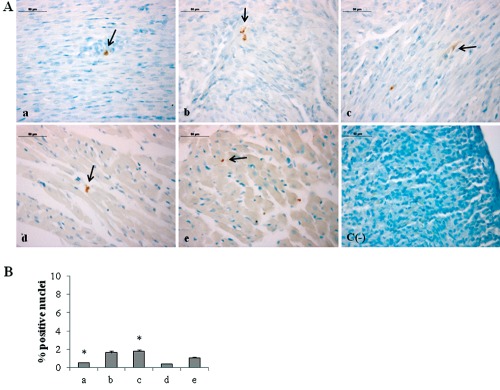
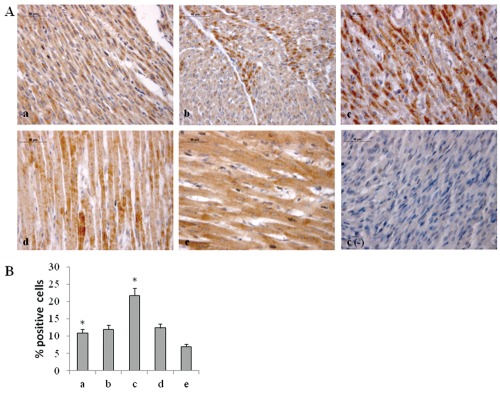
In premature babies birth an high oxygen level exposure can occur and newborn hyperoxia exposure can be associated with free radical oxygen release with impairment of myocardial function, while in adult animal models short exposure to hyperoxia seems to protect heart against ischemic injury. Thus, the mechanisms and consequences which take place after hyperoxia exposure are different and related to animals age. The aim of our work has been to analyze the role played by HIF-1α in the occurrence of the morphological modifications upon hyperoxia exposure in neonatal rat heart. Hyperoxia exposure induces connective compartment increase which seems to allow enhanced blood vessels growth. An increased hypoxia inducible factor-1α (HIF-1α) translocation and vascular endothelial growth factor (VEGF) expression has been found upon 95% oxygen exposure to induce morphological modifications. Upstream pPKC-α expression increase in newborn rats exposed to 95% oxygen can suggest PKC involvement in HIF-1α activation. Since nitric oxide synthase (NOS) are involved in heart vascular regulation, endothelial NOS (e-NOS) and inducible NOS (i-NOS) expression has been investigated: a lower eNOS and an higher iNOS expression has been found in newborn rats exposed to 95% oxygen related to the evidence that hyperoxia provokes a systemic vasoconstriction and to the iNOS pro-apoptotic action, respectively. The occurrence of apoptotic events, evaluated by TUNEL and Bax expression analyses, seems more evident in sample exposed to severe hyperoxia. All in all such results suggest that in newborn rats hyperoxia can trigger oxygen free radical mediated membrane injury through a pPKCα mediated HIF-1α signalling system, even though specificity of such response could be obtained by in vivo administration to the rats of specific inhibitors of PKCα. This intracellular signalling can switch molecular events leading to blood vessels development in parallel to pro-apoptotic events due to an immature anti-oxidant defensive system in newborn rat hearts.
Figures
Similar articles
-
Postnatal hyperoxia exposure differentially affects hepatocytes and liver haemopoietic cells in newborn rats.PLoS One. 2014 Aug 12;9(8):e105005. doi: 10.1371/journal.pone.0105005. eCollection 2014. PLoS One. 2014. PMID: 25115881 Free PMC article.
-
Hyperoxia exposure induces ferroptosis and apoptosis by downregulating PLAGL2 and repressing HIF-1α/VEGF signaling pathway in newborn alveolar typeII epithelial cell.Redox Rep. 2024 Dec;29(1):2387465. doi: 10.1080/13510002.2024.2387465. Epub 2024 Aug 5. Redox Rep. 2024. PMID: 39102510 Free PMC article.
-
Cellular and vascular changes in the retina of neonatal rats after an acute exposure to hypoxia.Invest Ophthalmol Vis Sci. 2009 Nov;50(11):5364-74. doi: 10.1167/iovs.09-3552. Epub 2009 May 27. Invest Ophthalmol Vis Sci. 2009. PMID: 19474404
-
Nitric Oxide-Dependent Pathways as Critical Factors in the Consequences and Recovery after Brain Ischemic Hypoxia.Biomolecules. 2021 Jul 26;11(8):1097. doi: 10.3390/biom11081097. Biomolecules. 2021. PMID: 34439764 Free PMC article. Review.
-
Kidney Injuries and Evolution of Chronic Kidney Diseases Due to Neonatal Hyperoxia Exposure Based on Animal Studies.Int J Mol Sci. 2022 Jul 31;23(15):8492. doi: 10.3390/ijms23158492. Int J Mol Sci. 2022. PMID: 35955627 Free PMC article. Review.
Cited by
-
NF-κB involvement in hyperoxia-induced myocardial damage in newborn rat hearts.Histochem Cell Biol. 2013 Nov;140(5):575-83. doi: 10.1007/s00418-013-1092-y. Epub 2013 Apr 9. Histochem Cell Biol. 2013. PMID: 23568329
-
Postnatal hyperoxia exposure differentially affects hepatocytes and liver haemopoietic cells in newborn rats.PLoS One. 2014 Aug 12;9(8):e105005. doi: 10.1371/journal.pone.0105005. eCollection 2014. PLoS One. 2014. PMID: 25115881 Free PMC article.
-
On the future contents of a small journal of histochemistry.Eur J Histochem. 2012 Dec 10;56(4):e51. doi: 10.4081/ejh.2012.e51. Eur J Histochem. 2012. PMID: 23361247 Free PMC article.
-
Histochemistry as an irreplaceable approach for investigating functional cytology and histology.Eur J Histochem. 2013 Dec 19;57(4):e41. doi: 10.4081/ejh.2013.e41. Eur J Histochem. 2013. PMID: 24441194 Free PMC article.
-
Opposing Effects of Oxygen Regulation on Kallistatin Expression: Kallistatin as a Novel Mediator of Oxygen-Induced HIF-1-eNOS-NO Pathway.Oxid Med Cell Longev. 2017;2017:5262958. doi: 10.1155/2017/5262958. Epub 2017 Dec 13. Oxid Med Cell Longev. 2017. PMID: 29387292 Free PMC article. Review.
References
-
- Wittnich C, Torrance SM, Carlyle CE. Effects of hyperoxia on neonatal myocardial energy status and response to global ischemia. Ann Thorac Surg. 2000;70:2125–31. - PubMed
-
- Allen BS, Barth MJ, Ilbawi MN. Pediatric myocardial protection: an overview. Semin Thorac Cardiovasc Surg. 2001;13:56–72. - PubMed
-
- Thibeault DW. The precarious antioxidant defenses of the preterm infant. Am J Perinatol. 2000;17:167–81. - PubMed
-
- Saugstad OD. Oxidative stress in the newborn-a 30-year perspective. Biol Neonate. 2005;88:228–36. - PubMed
-
- Hirschl RB, Heiss KF, Bartlett RH. Severe myocardial dysfunction during extracorporeal membrane oxygenation. J Pediatr Surg. 1992;27:48–53. - PubMed
Publication types
MeSH terms
Substances
LinkOut - more resources
Full Text Sources
Research Materials