

Lentivector transduction improves outcomes over transplantation of human HSCs alone in NOD/SCID/Fabry mice
- PMID: 22472949
- PMCID: PMC3393855
- DOI: 10.1038/mt.2012.64
Lentivector transduction improves outcomes over transplantation of human HSCs alone in NOD/SCID/Fabry mice
Abstract
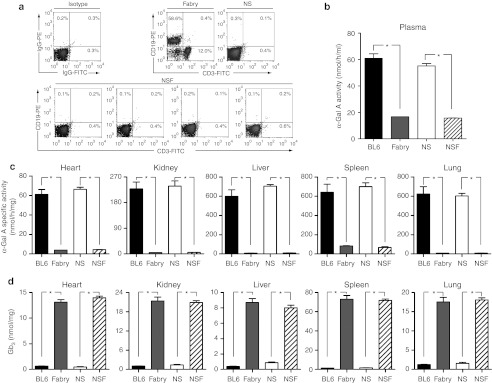
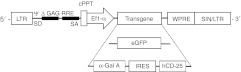
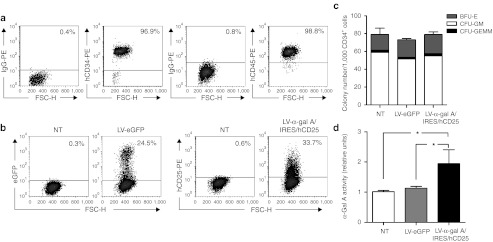
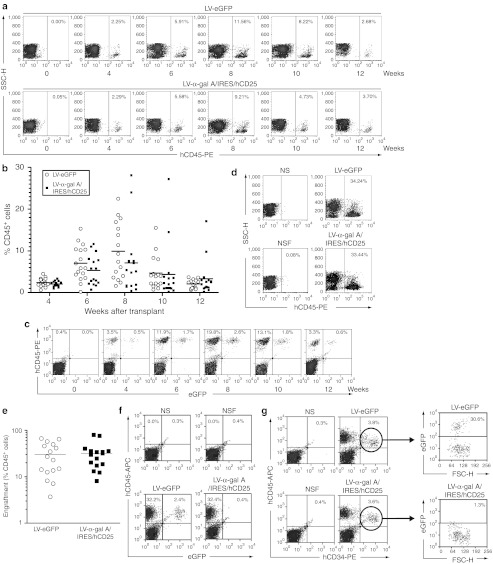
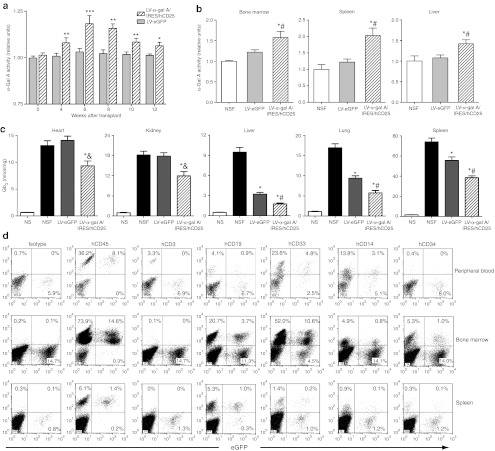
Fabry disease is a lysosomal storage disorder caused by a deficiency of α-galactosidase A (α-gal A) activity that results in progressive globotriaosylceramide (Gb(3)) deposition. We created a fully congenic nonobese diabetic (NOD)/severe combined immunodeficiency (SCID)/Fabry murine line to facilitate the in vivo assessment of human cell-directed therapies for Fabry disease. This pure line was generated after 11 generations of backcrosses and was found, as expected, to have a reduced immune compartment and background α-gal A activity. Next, we transplanted normal human CD34(+) cells transduced with a control (lentiviral vector-enhanced green fluorescent protein (LV-eGFP)) or a therapeutic bicistronic LV (LV-α-gal A/internal ribosome entry site (IRES)/hCD25). While both experimental groups showed similar engraftment levels, only the therapeutic group displayed a significant increase in plasma α-gal A activity. Gb(3) quantification at 12 weeks revealed metabolic correction in the spleen, lung, and liver for both groups. Importantly, only in the therapeutically-transduced cohort was a significant Gb(3) reduction found in the heart and kidney, key target organs for the amelioration of Fabry disease in humans.
Figures
Similar articles
-
Alpha-galactosidase A-Tat fusion enhances storage reduction in hearts and kidneys of Fabry mice.Mol Med. 2010 May-Jun;16(5-6):216-21. doi: 10.2119/molmed.2009.00163. Epub 2010 Feb 17. Mol Med. 2010. PMID: 20454522 Free PMC article.
-
Long-term correction of globotriaosylceramide storage in Fabry mice by recombinant adeno-associated virus-mediated gene transfer.Proc Natl Acad Sci U S A. 2003 Mar 18;100(6):3450-4. doi: 10.1073/pnas.0537900100. Epub 2003 Mar 6. Proc Natl Acad Sci U S A. 2003. PMID: 12624185 Free PMC article.
-
Efficient correction of Fabry mice and patient cells mediated by lentiviral transduction of hematopoietic stem/progenitor cells.Gene Ther. 2007 Feb;14(3):256-65. doi: 10.1038/sj.gt.3302839. Epub 2006 Aug 24. Gene Ther. 2007. PMID: 16929352
-
Gene therapy for Fabry disease.J Inherit Metab Dis. 2001;24 Suppl 2:25-41; discussion 11-2. doi: 10.1023/a:1012455421014. J Inherit Metab Dis. 2001. PMID: 11758676 Review.
-
Genetics and Gene Therapy of Anderson-Fabry Disease.Curr Gene Ther. 2018;18(2):96-106. doi: 10.2174/1566523218666180404161315. Curr Gene Ther. 2018. PMID: 29618309 Review.
Cited by
-
Relative distribution of Gb3 isoforms/analogs in NOD/SCID/Fabry mice tissues determined by tandem mass spectrometry.Bioanalysis. 2016 Sep;8(17):1793-807. doi: 10.4155/bio-2016-0116. Epub 2016 Aug 15. Bioanalysis. 2016. PMID: 27523577 Free PMC article.
-
Prevention of Lethal Murine Hypophosphatasia by Neonatal Ex Vivo Gene Therapy Using Lentivirally Transduced Bone Marrow Cells.Hum Gene Ther. 2015 Dec;26(12):801-12. doi: 10.1089/hum.2015.078. Epub 2015 Nov 19. Hum Gene Ther. 2015. PMID: 26467745 Free PMC article.
-
Treatment of Fabry Disease: Established and Emerging Therapies.Pharmaceuticals (Basel). 2023 Feb 20;16(2):320. doi: 10.3390/ph16020320. Pharmaceuticals (Basel). 2023. PMID: 37259462 Free PMC article. Review.
-
Lentivector Iterations and Pre-Clinical Scale-Up/Toxicity Testing: Targeting Mobilized CD34+ Cells for Correction of Fabry Disease.Mol Ther Methods Clin Dev. 2017 May 12;5:241-258. doi: 10.1016/j.omtm.2017.05.003. eCollection 2017 Jun 16. Mol Ther Methods Clin Dev. 2017. PMID: 28603745 Free PMC article.
-
Autologous, lentivirus-modified, T-rapa cell "micropharmacies" for lysosomal storage disorders.EMBO Mol Med. 2022 Apr 7;14(4):e14297. doi: 10.15252/emmm.202114297. Epub 2022 Mar 17. EMBO Mol Med. 2022. PMID: 35298086 Free PMC article.
References
-
- Brady RO, Gal AE, Bradley RM, Martensson E, Warshaw AL., and, Laster L. Enzymatic defect in Fabry disease: ceramidetrihexosidase deficiency. N Engl J Med. 1967;276:1163–1167. - PubMed
-
- Schiffmann R. Neuropathy and Fabry disease: pathogenesis and enzyme replacement therapy. Acta Neurol Belg. 2006;106:61–65. - PubMed
Publication types
MeSH terms
Substances
Grants and funding
LinkOut - more resources
Full Text Sources
Other Literature Sources
Medical
Molecular Biology Databases
Research Materials
