. 2012 Apr 1;13(5):511-8.
doi: 10.1038/ni.2247.

Intrathymic programming of effector fates in three molecularly distinct γδ T cell subtypes

Collaborators, Affiliations

Intrathymic programming of effector fates in three molecularly distinct γδ T cell subtypes

Kavitha Narayan et al. Nat Immunol. .

Abstract

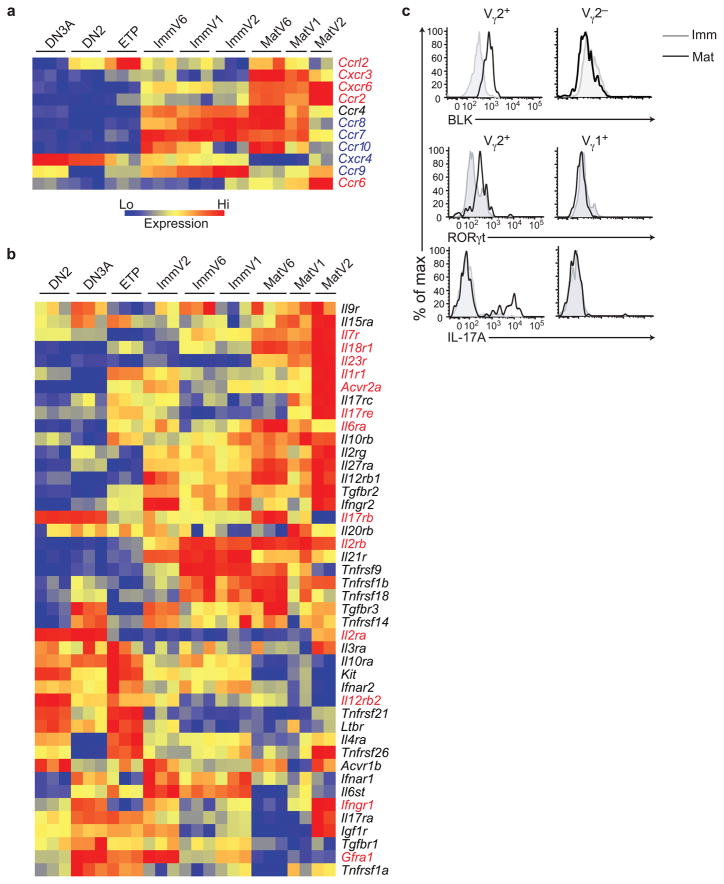
Innate γδ T cells function in the early phase of immune responses. Although innate γδ T cells have often been studied as one homogenous population, they can be functionally classified into effector subsets on the basis of the production of signature cytokines, analogous to adaptive helper T cell subsets. However, unlike the function of adaptive T cells, γδ effector T cell function correlates with genomically encoded T cell antigen receptor (TCR) chains, which suggests that clonal TCR selection is not the main determinant of the differentiation of γδ effector cells. A high-resolution transcriptome analysis of all emergent γδ thymocyte subsets segregated on the basis of use of the TCR γ-chain or δ-chain indicated the existence of three separate subtypes of γδ effector cells in the thymus. The immature γδ subsets were distinguished by unique transcription-factor modules that program effector function.


Figures

Figure 1
Figure 1
Distinct global gene expression profiles of γδ cell subsets defined by TCR repertoire. The mean expression of sample replicates for consolidated probe sets was plotted to compare populations of immature adult thymocytes, immature fetal thymocytes, and mature thymocytes from C57BL/6 mice using Multiplot. Each dot represents one gene (mean of all probe sets), and dots highlighted in red represent genes whose expression is changed by greaterthan 2 fold, P<0.05, coefficient of variation (cv)<0.5, mean expression value (MEV)>120 in one subset. The total number of highlighted genes is listed in parenthesis at the top of each scatter plot. CD4+Foxp3 and CD4+Foxp3+ samples were isolated from the spleen. Similar results were obtained when CD8+CD24int thymocytes were compared with immV2 cells (615 genes). The following abbreviations were used that correlate with the indicated ImmGen populations: ImmV2=immTgd.vg2+.Th; ImmV1=immTgd.vg1+vd6−.Th; ImmV6=immTgd.vg1+vd6+.Th; ImmV5=immTgd.vg5+.Th (sorted in duplicate); MatV2= matTgd.vg2+.Th (sorted in duplicate); MatV1=matTgd.vg1+vd6−.Th (sorted in duplicate); MatV6=matTgd.vg1+vd6+.Th; Semi-matCD8=T.8SP24int.Th; DP=T.DP.Th (CD69−); CD69+DP=T.DP69+.Th; Totalγδ=Tgd.Th; ISP=T.ISP.Th; MatCD8=T.8SP24−.Th; CD4+FoxP3=T.4FP3−.Sp CD4+FoxP3+=T.4FP3+25+.Sp; ImmV2.e17=immTgd.vg2.e17.Th; ImmV3.e17=immTgd.vg3.e17.Th; ImmV4.e17=immTgd. vg4.e17.Th; ETP=preT.ETP.Th; DN2=preT.DN2.Th; DN3A=preT.DN3A.Th; MatCD4=T.4SP24−.Th; DN4=T.DN4.Th; iNKT=NKT.44+NK1.1+.Th (unless otherwise specified).
Figure 2
Figure 2
Distinct TF protein expression and divergence of γδ T cell subsets. (a) Histograms of the expression of transcription factors in immature (CD24hi) and mature (CD24lo) V2, V1, and V6 γδ thymocytes are shown. Histograms of TF expression were generated by gating on total TCRδ+ cells, subsetting cells based on Vγ2, Vγ1.1, and Vδ6.3 expression, and gating on CD24hi or CD24lo cells within each subset. Plots straddling V1 and V6 columns represent histograms gated on total Vγ1.1+ cells. Isotype control staining is shown for each TF (grey histograms). For GATA-3 staining, a FACS minus one (FMO) control was used, and for RORγt, a negative control was used (TCRβhi cells that are negative for RORγt expression). SMO is shown as a representative TF expressed similarly among immature subsets and downregulated upon maturation. In some cases, gates were drawn on the “high” expressers for a given TF to best show the relative difference in expression among the γδ subsets. A minimum of 3 mice were analyzed per experiment, and a minimum 2 experiments were performed per marker. (b) PCA on the populations shown was performed using the 15% most variable genes (MEV>120 in at least one population, 1594 genes). The first three PCs are shown, along with the proportion of the total variability represented by each component. Expression of CD44 (44) and NK1.1 (NK) are designated for iNKT subsets. (c) PCA on the populations shown was performed using the 15% most variable genes (MEV>120 in at least one population, 1597 genes).
Figure 3
Figure 3
Expression of TFs and metabolic genes distinguishes γδ thymocyte subsets. (a) PCA was performed on the populations shown using the genes that were differentially regulated among immV2 and immV1 or immV6 cells (1006 genes, see Supplementary Figure 3a, Supplementary Table 1, 2). The first three PCs are shown along with the proportion of the total variability represented by each component. (b, c) Heatmaps of relative expression of genes involved in metabolic processes (b) and of TFs (c) in thymocyte subsets that were differentially regulated among ImmV2 and immV1 or immV6 cells. For heatmaps, data were log transformed, gene row centered, and hierarchically clustered by gene and subset, and genes are color coded (see legend) to display relative expression. TFs discussed in the text are in red font. In (b), interspersed immV1 and immV6 replicates are grouped together.
Figure 4
Figure 4
Convergence of gene expression profiles of γδ subsets upon maturation. (a) PCA was performed on the populations shown using the 495 genes that were differentially regulated upon maturation of adult γδ T cells (see Supplementary Fig. 5, Supplementary Table 7). The first three PCs are shown along with the proportion of the total variability represented by each component. (b) Heatmap showing the expression of the 495 genes of the γδ maturation gene signature in precursor, αβ, and γδ T cell subsets. The dendrogram for sample clustering shows that immature and mature subsets form two distinct clusters irrespective of T cell lineage. (c, d) Heatmaps of relative expression of metabolic genes (c) and TFs (d) in immature and mature γδ subsets. For all heatmaps, data were log transformed, gene row centered, and hierarchically clustered by gene and subset, and genes are color coded (see legend) to display relative expression. In (c), interspersed immV1 and immV6 replicates are grouped together.
Figure 5
Figure 5
Generation of mature γδ cell subsets poised for elaboration of effector function programs. (a) Heatmap of the relative expression of select chemokine receptors is shown. Chemokine receptors expressed in immature subsets and extinguished or downregulated as γδ T cells mature (blue) and chemokine receptors induced precipitously during maturation and maintained in fully differentiated subsets (red) are indicated. (b) Heatmap of relative expression of select cytokine and growth factor receptors is shown. For heatmaps, data were log transformed, gene row centered, and hierarchically clustered by gene and subset, and genes are color coded (see legend) to display relative expression. (c) Representative BLK, RORγt, and IL-17A expression in immature and mature γδ thymocyte subsets. Histograms were gated on total TCRδ+ cells, separated into Vγ2+ and Vγ2 populations, and gated on CD24hi (light grey line) or CD24lo (black line) to show expression of the indicated markers in overlays. BLK and IL-17A protein expression could only be discerned in mature Vγ2+ thymocytes, whereas a low amount of RORγt was expressed in immV2 cells (Fig. 2). For IL-17A expression, cells were stimulated for 4 hours with PMA-ionomycin followed by surface and intracellular cytokine staining. One of 6 experiments is shown, each with a minimum of three mice per experiment.
Figure 6
Figure 6
Common features of αβ iNKT cells and γδ matV6 cells. (a, b) iNKT signature genes were identified using Multiplot based on being altered by 2-fold or more in expression in bothαβNKT versus matCD4 and αβNKT versus matCD8 comparisons, and having a cv<0.5, and MEV>120 in at least one subset. A total of 292 genes were increased in iNKT versus matCD4-CD8 cells, and 248 genes were decreased in iNKT versus matCD4-CD8 cells. Fold change (FC) versus P-value volcano plots of iNKT versus matCD4 (a) and iNKT versus matCD8 (b) are shown with the genes upregulated in iNKT cells in both comparisons in red, and the genes downregulated in iNKT cells in both comparisons in blue. The names and locations of select genes, including Zbtb16 are indicated with arrows. (c) PCA was performed on the populations shown using the 540 genes that were differentially regulated between iNKT cells and matCD4 and matCD8 cells. The first three PCs are shown along with the proportion of the total variability represented by each component. (d, e) Representative FACS plots showing Vγ1.1 and Vδ6.3 staining on C57BL/6 and Cd74−/− (d) or Ctsl/ (e) γδ thymocytes (left). Frequencies of V6 cells among γδ T cells for all mice analyzed were graphed (right). Each symbol represents an individual mouse. Horizontal bars represent the mean ±s.d. **P=0.005 and *P=0.04 (two-tailed Student’s t-test). Data shown were combined from two independent experiments.

Comment in

Similar articles

Cited by

  • Diversity of γδ T-cell antigens.
    Born WK, Kemal Aydintug M, O'Brien RL. Born WK, et al. Cell Mol Immunol. 2013 Jan;10(1):13-20. doi: 10.1038/cmi.2012.45. Epub 2012 Oct 22. Cell Mol Immunol. 2013. PMID: 23085946 Free PMC article. Review.
  • Development of γδ T Cells: Soldiers on the Front Lines of Immune Battles.
    Contreras AV, Wiest DL. Contreras AV, et al. Methods Mol Biol. 2023;2580:71-88. doi: 10.1007/978-1-0716-2740-2_4. Methods Mol Biol. 2023. PMID: 36374451
  • The transcriptional landscape of αβ T cell differentiation.
    Mingueneau M, Kreslavsky T, Gray D, Heng T, Cruse R, Ericson J, Bendall S, Spitzer MH, Nolan GP, Kobayashi K, von Boehmer H, Mathis D, Benoist C; Immunological Genome Consortium; Best AJ, Knell J, Goldrath A, Joic V, Koller D, Shay T, Regev A, Cohen N, Brennan P, Brenner M, Kim F, Nageswara Rao T, Wagers A, Heng T, Ericson J, Rothamel K, Ortiz-Lopez A, Mathis D, Benoist C, Bezman NA, Sun JC, Min-Oo G, Kim CC, Lanier LL, Miller J, Brown B, Merad M, Gautier EL, Jakubzick C, Randolph GJ, Monach P, Blair DA, Dustin ML, Shinton SA, Hardy RR, Laidlaw D, Collins J, Gazit R, Rossi DJ, Malhotra N, Sylvia K, Kang J, Kreslavsky T, Fletcher A, Elpek K, Bellemare-Pelletier A, Malhotra D, Turley S. Mingueneau M, et al. Nat Immunol. 2013 Jun;14(6):619-32. doi: 10.1038/ni.2590. Epub 2013 May 5. Nat Immunol. 2013. PMID: 23644507 Free PMC article.
  • γδTCR-independent origin of neonatal γδ T cells prewired for IL-17 production.
    Spidale NA, Frascoli M, Kang J. Spidale NA, et al. Curr Opin Immunol. 2019 Jun;58:60-67. doi: 10.1016/j.coi.2019.04.011. Epub 2019 May 23. Curr Opin Immunol. 2019. PMID: 31128446 Free PMC article. Review.
  • Developmental gene networks: a triathlon on the course to T cell identity.
    Yui MA, Rothenberg EV. Yui MA, et al. Nat Rev Immunol. 2014 Aug;14(8):529-45. doi: 10.1038/nri3702. Nat Rev Immunol. 2014. PMID: 25060579 Free PMC article. Review.

References

    1. Heng TS, Painter MW. The Immunological Genome Project: networks of gene expression in immune cells. Nat Immunol. 2008;9:1091–1094. - PubMed
    1. Ferrick DA, et al. Differential production of interferon-γ and interleukin-4 in response to Th1-and Th2-stimulating pathogens by γδ T cells in vivo. Nature. 1995;373:255–257. - PubMed
    1. Stark MA, et al. Phagocytosis of apoptotic neutrophils regulates granulopoiesis via IL-23 and IL-17. Immunity. 2005;22:285–294. - PubMed
    1. Hayday A, Tigelaar R. Immunoregulation in the tissues by γδ T cells. Nature Rev Immunol. 2003;3:233–242. - PubMed
    1. Berg LJ. Signalling through TEC kinases regulates conventional versus innate CD8(+) T-cell development. Nature Rev Immunol. 2007;7:479–485. - PubMed

Publication types

MeSH terms

Associated data