. 2012 May 16;31(10):2416-26.
doi: 10.1038/emboj.2012.80. Epub 2012 Mar 30.

Short nucleosome repeats impose rotational modulations on chromatin fibre folding

Affiliations

Short nucleosome repeats impose rotational modulations on chromatin fibre folding

Sarah J Correll et al. EMBO J. .

Abstract

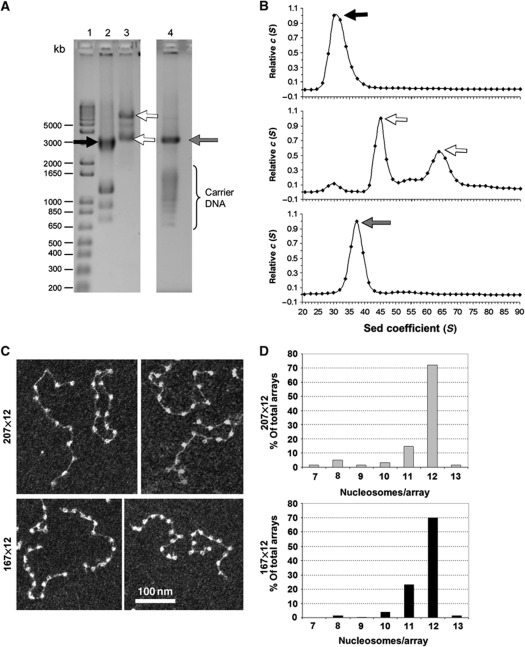
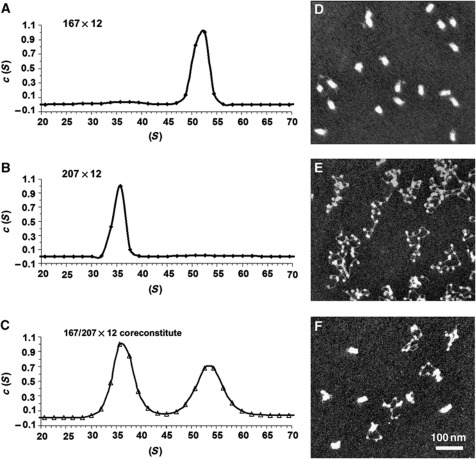
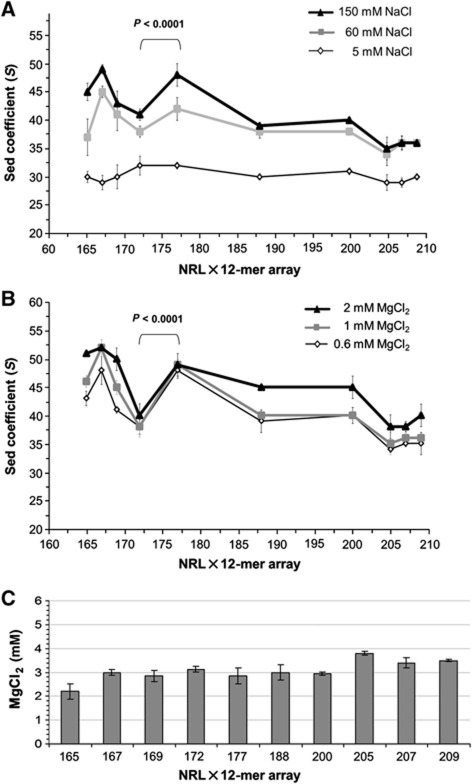
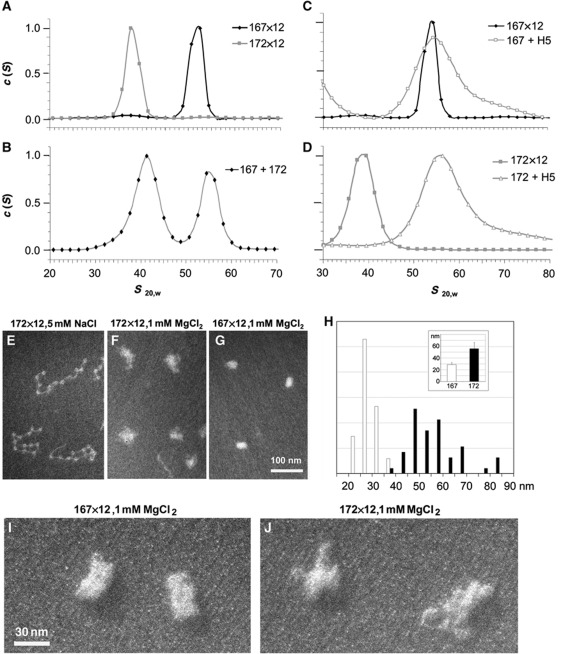
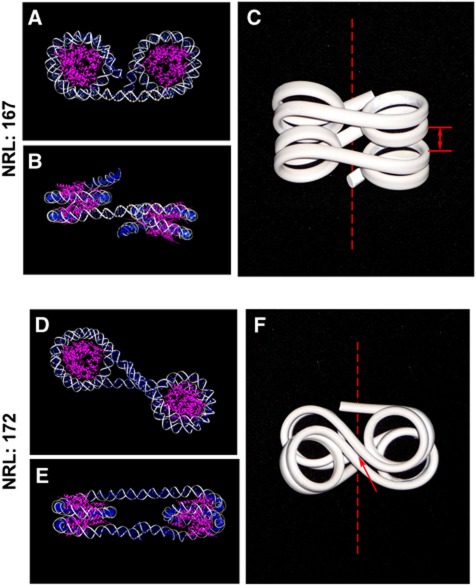
In eukaryotic cells, DNA is organized into arrays of repeated nucleosomes where the shorter nucleosome repeat length (NRL) types are associated with transcriptionally active chromatin. Here, we tested a hypothesis that systematic variations in the NRL influence nucleosome array folding into higher-order structures. For NRLs with fixed rotational settings, we observed a negative correlation between NRL and chromatin folding. Rotational variations within a range of longer NRLs (188 bp and above) typical of repressed chromatin in differentiated cells did not reveal any changes in chromatin folding. In sharp contrast, for the shorter NRL range of 165-177 bp, we observed a strong periodic dependence of chromatin folding upon the changes in linker DNA lengths, with the 172 bp repeat found in highly transcribed yeast chromatin imposing an unfolded state of the chromatin fibre that could be reversed by linker histone. Our results suggest that the NRL may direct chromatin higher-order structure into either a nucleosome position-dependent folding for short NRLs typical of transcribed genes or an architectural factor-dependent folding typical of longer NRLs prevailing in eukaryotic heterochromatin.


Conflict of interest statement

The authors declare that they have no conflict of interest.

Figures

Figure 1
Figure 1
Oligonucleosome reconstitution and characterization. (A) DNP type IV agarose gel in HE buffer, showing reconstituted nucleosome arrays, 169×12 arrays with different histone loadings. Lanes 1–4: 1—DNA molecular weight markers, 2—underloaded (black arrow), 3—overloaded (white arrows), and 4—properly loaded (grey arrow) nucleosome arrays. (B) Distributions of sedimentation coefficients, c(S), for 169×12 arrays with different histone loadings: underloaded (top panel), overloaded (middle panel), and properly loaded (bottom panel) at 0.6 mM MgCl2. (C) Electron micrograph (uranyl acetate staining, dark-field imaging) of 207×12 core arrays (top panels) and 167×12 core arrays (bottom panels) fixed at 5 mM NaCl. (D) Histograms showing distribution of nucleosome arrays containing a certain number of nucleosomes per array calculated from several EM fields of 207×12 arrays (top panel) and 167×12 arrays (bottom panel).
Figure 2
Figure 2
Nucleosome array folding depends upon the intrinsic properties of the underlying NRL. (AC) Distribution of sedimentation coefficients, c(S), for 167×12 (A), 207×12 (B), and the 167/207×12 coreconstitute (C) at 1 mM MgCl2. (DF) Electron micrographs of 167×12 (D), 207×12 (E), and the 167/207×12 coreconstitute (F) at 1 mM MgCl2 showing different degrees of compaction.
Figure 3
Figure 3
Dependence of chromatin compaction upon NRL for nucleosome arrays with constant internucleosomal rotations. Distribution of sedimentation coefficients, c(S), for 12-mer oligonucleosome core arrays with NRL of 167, 177, 188, and 209 bp at 5 mM NaCl (A), 150 mM NaCl (B), and 1 mM MgCl2 (C).
Figure 4
Figure 4
NRL variations affect chromatin folding but not self-association. (A) Graphic plotting of main sedimentation coefficient peaks in c(S) distribution (average of three independent experiments) for 12-mer oligonucleosome core arrays with varying NRL (165,167,169, 172, 177, 188, 200, 205, 207, and 209 bp) at 5 mM NaCl, 60 mM NaCl, or 150 mM NaCl. Student’s t-test P-values for significant differences between the data sets are shown over the brackets. (B) Graphic plotting of main sedimentation coefficient peaks in c(S) distribution (average of three independent experiments) for 12-mer oligonucleosome core arrays with varying NRL (165, 167, 169, 172, 177, 188, 200, 205, 207, and 209 bp) at 0.6 mM MgCl2, 1 mM MgCl2, or 2 mM MgCl2. (C) Histograms of the concentration of MgCl2 (average of three independent experiments) that results in 50% precipitation of material for arrays with varying NRL.
Figure 5
Figure 5
A 5-bp difference in linker DNA length destabilizes chromatin folding for short NRLs. (A–D) Distribution of sedimentation coefficients, c(S), at 1 mM MgCl2 for separately analysed 167×12 and 172×12 core arrays (A), 167/172×12 coreconstitute (B), 167×12 reconstituted with and without linker histone (C), and 172×12 reconstituted with and without linker histone (D). (EG) Electron micrographs of 172×12 core arrays at 5 mM NaCl (E) and 172×12 (F) and 167×12 (G) at 1 mM MgCl2 showing different degrees of compaction. EM magnification 42K. (H) Histogram showing particle size distribution of 167×12 arrays (white columns) and 172×12 arrays (black columns) condensed in 1 mM MgCl2. The inset shows average particle size measured at the Y-axis and X-axis for the 167×12 arrays and 172×12 arrays. Error bars in the inset represent s.d.’s. (I, J) Electron micrographs of 167×12 and 172×12 core arrays at 1 mM MgCl2 showing different degrees of compaction. The samples were contrasted by platinum shadowing. EM magnification 110K.
Figure 6
Figure 6
Molecular modelling shows the proposed effect on chromatin folding of the 5-bp difference in the NRL between the 167 bp and 172 bp repeats. (A, B) Molecular model of the dinucleosome with NRL 167 (X–Y and Z–Y planes are shown) was constructed using UCSF Chimera (http://plato.cgl.ucsf.edu/chimera/) based on 147 bp from the clone 601 nucleosome core structure PDB 3MVD for the nucleosome after removing RCC protein from the file. For adding linker DNA, we used a DNA fragment containing base pairs DG345I/DC3J through DC336I/DG12J from PDB 1ZBB and aligned multiple copies in three-dimensional space to get the 20-bp linker length and 167 bp NRL. (C) A flexible wire model for DNA geometry in a compact tetranucleosome with NRL 167. The dashed lines show the 30-nm fibre axis. The arrows show the points of contact that limit the longitudinal compaction of the fibre. (DE) Molecular model of the dinucleosomes with NRL 207 based on 147 bp from the clone 601 and constructed as in panels A–B but adding 25-bp linker DNA to get 172 bp NRL. (F) A flexible wire model for DNA geometry in a compact tetranucleosome with NRL 172. The dashed line and the arrow indicate the fibre axis and the points of contact as in panel C.

References

    1. Allahverdi A, Yang R, Korolev N, Fan Y, Davey CA, Liu CF, Nordenskiold L (2011) The effects of histone H4 tail acetylations on cation-induced chromatin folding and self-association. Nucleic Acids Res 39: 1680–1691 - PMC - PubMed
    1. Athey BD, Smith MF, Rankert DA, Williams SP, Langmore JP (1990) The diameters of frozen-hydrated chromatin fibers increase with DNA linker length: evidence in support of variable diameter models for chromatin. J Cell Biol 111: 795–806 - PMC - PubMed
    1. Birnboim HC, Doly J (1979) A rapid alkaline extraction procedure for screening recombinant plasmid DNA. Nucleic Acids Res 7: 1513–1523 - PMC - PubMed
    1. Carruthers LM, Bednar J, Woodcock CL, Hansen JC (1998) Linker histones stabilize the intrinsic salt-dependent folding of nucleosomal arrays: mechanistic ramifications for higher-order chromatin folding. Biochemistry 37: 14776–14787 - PubMed
    1. Carruthers LM, Schirf VR, Demeler B, Hansen JC (2000) Sedimentation velocity analysis of macromolecular assemblies. Methods Enzymol 321: 66–80 - PubMed

Publication types

LinkOut - more resources