. 2012 Apr 9;209(4):775-92.
doi: 10.1084/jem.20112422. Epub 2012 Apr 2.

Essential role of EBF1 in the generation and function of distinct mature B cell types

Affiliations

Essential role of EBF1 in the generation and function of distinct mature B cell types

Bojan Vilagos et al. J Exp Med. .

Abstract

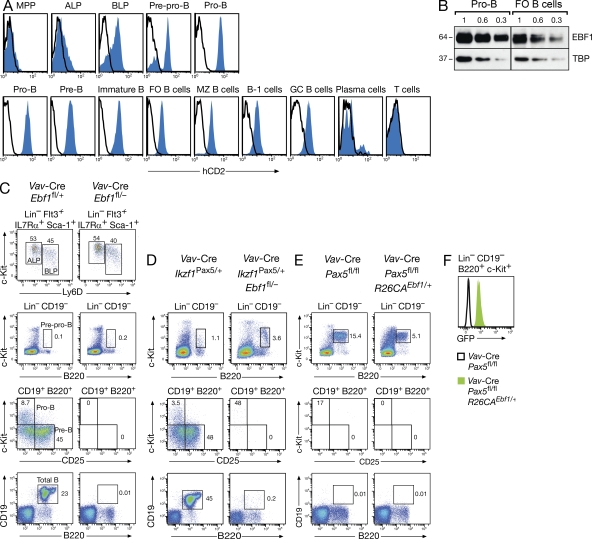
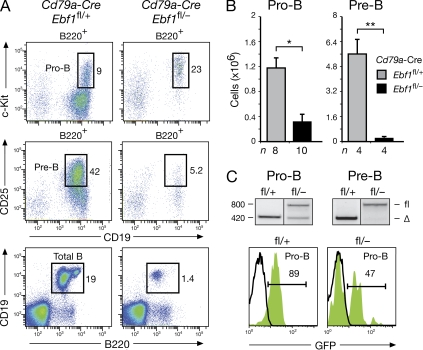
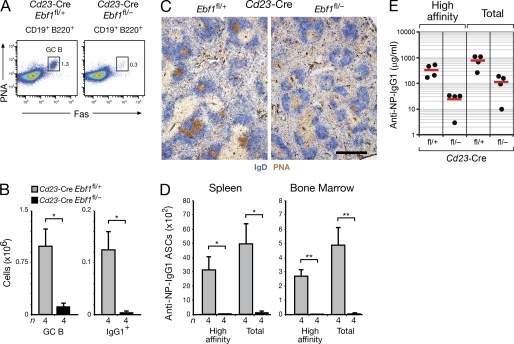
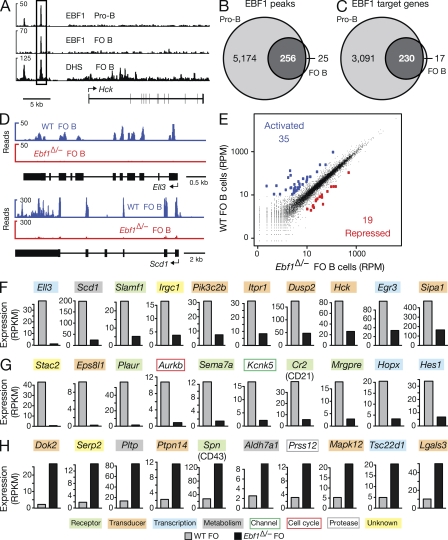
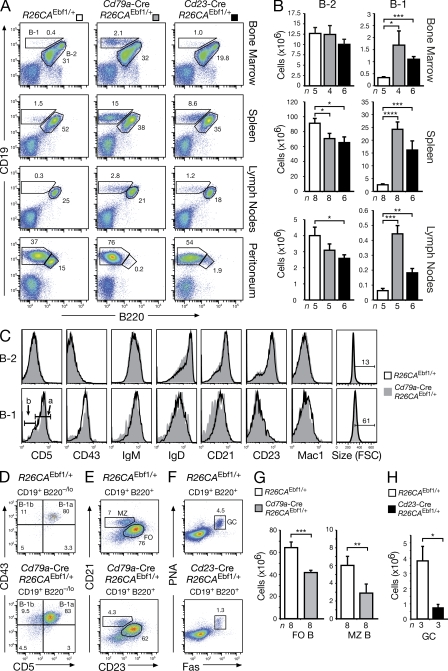
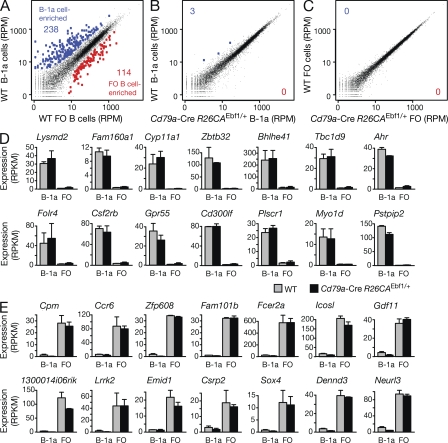
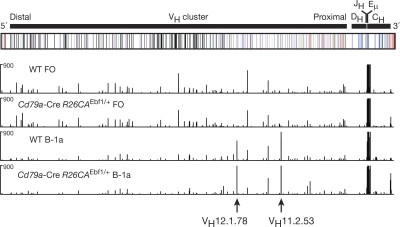
The transcription factor EBF1 is essential for lineage specification in early B cell development. In this study, we demonstrate by conditional mutagenesis that EBF1 is required for B cell commitment, pro-B cell development, and subsequent transition to the pre-B cell stage. Later in B cell development, EBF1 was essential for the generation and maintenance of several mature B cell types. Marginal zone and B-1 B cells were lost, whereas follicular (FO) and germinal center (GC) B cells were reduced in the absence of EBF1. Activation of the B cell receptor resulted in impaired intracellular signaling, proliferation and survival of EBF1-deficient FO B cells. Immune responses were severely reduced upon Ebf1 inactivation, as GCs were formed but not maintained. ChIP- and RNA-sequencing of FO B cells identified EBF1-activated genes that encode receptors, signal transducers, and transcriptional regulators implicated in B cell signaling. Notably, ectopic expression of EBF1 efficiently induced the development of B-1 cells at the expense of conventional B cells. These gain- and loss-of-function analyses uncovered novel important functions of EBF1 in controlling B cell immunity.


Figures

Figure 1.
Figure 1.
Nonredundant functions of EBF1 and Pax5 in early B cell development. (A) Ebf1ihCd2/+ (blue) and WT (black line) mice were analyzed by flow cytometry for human (h) CD2 expression in different progenitors, B cell types, and T cells, which were defined as described in Materials and methods. (B) Expression of EBF1 protein in cultured pro–B cells and MACS-sorted FO B cells from lymph nodes. One of two immunoblot experiments is shown. Numbers indicate the relative proportion of nuclear extracts analyzed. The EBF1 protein abundance is normalized to expression of the TBP, and the size (kilodaltons) of the two proteins is indicated to the left. (C and D) B cell development in Vav-Cre Ebf1fl/− mice with or without ectopic Pax5 expression from the Ikzf1Pax5 allele. Progenitor and B cell types were investigated by flow cytometry of bone marrow cells isolated from mice of the indicated genotypes. The relative percentage of each cell type is indicated in the respective quadrant, and the gating is shown above the FACS plot. The different cell types were defined as described in Materials and methods. (E and F) B cell development in Vav-Cre Pax5fl/fl mice with or without ectopic EBF1 expression from the R26CAEbf1 allele (E). GFP expression, indicating EBF1 expression, in Pax5-deficient progenitors of Vav-Cre R26CAEbf1/+ Pax5fl/fl mice (F). Number of mice of each genotype analyzed: n = 8 (C); n = 5 (D); and n = 3 (E).
Figure 2.
Figure 2.
Function of EBF1 in early B cell development. (A and B) Relative percentages (A) and absolute numbers (B) of pro–B and pre–B cells were determined by flow cytometric analysis of bone marrow from Cd79a-Cre Ebf1fl/+ mice (gray bars; fl/+) and Cd79a-Cre Ebf1fl/− littermates (black bars; fl/−). n, number of mice analyzed. Statistical data (B) are shown with SEM and were analyzed by Student’s t test. *, P < 0.05; **, P < 0.01. (C) Deletion of the floxed Ebf1 allele in pro–B and pre–B cells was analyzed by PCR and GFP expression. The PCR fragments corresponding to the deleted (Δ) or intact (fl) floxed allele are indicated to the right and their size (base pairs) to the left of the gel.
Figure 3.
Figure 3.
Role of EBF1 in late B lymphopoiesis. (A and B) Relative percentages and absolute numbers of B-1, MZ, and FO B cells were analyzed by flow cytometry of the spleen from Cd23-Cre Ebf1fl/+ mice (gray bars) and Cd23-Cre Ebf1fl/− littermates (black bars) at the age of 8 (A) and 16 (B) weeks. n, number of mice analyzed. Statistical data are shown with SEM and were analyzed by the Student’s t test. **, P < 0.01; ***, P < 0.001. (C) PCR genotyping of sorted FO, MZ, and B1 B cells of the indicated genotypes. The size (base pairs) and identity of the PCR fragments is shown to the left and right of the gel, respectively. C, genomic Ebf1fl/fl or Ebf1fl/Δ control DNA. (D) CD23+ splenic B cells of the indicated genotypes were isolated by MACS sorting before immunoblot analysis of serially diluted nuclear extracts (indicated by wedges) with EBF1, TBP, and Pax5 antibodies. The size (kilodaltons) of the proteins is indicated to the left. One of two immunoblots is shown. (E) Flow cytometric analysis of the cell surface phenotype of mature B cells (IgMloIgDhi) from the spleen of Cd23-Cre Ebf1fl/+ mice (gray) and Cd23-Cre Ebf1fl/− littermates (black line). (F) Analysis of MZ B cells as CD1dhiCD21hi splenic B cells in 8-mo-old Cd23-Cre Ebf1fl/− and control Cd23-Cre Ebf1fl/+ littermates.
Figure 4.
Figure 4.
Impaired maintenance of GC B cells in the absence of EBF1. (A and B) The abundance and immunoglobulin class switching of splenic GC B cells were determined by flow cytometry as relative percentages (A) and absolute cell numbers (B). 7 d after immunization of Cd23-Cre Ebf1fl/+ mice (gray bars) and Cd23-Cre Ebf1fl/− mice (black bars) with SRBCs. n, number of mice analyzed. (C) PCR genotyping of sorted GC B cells 7 d after immunization with SRBCs. The size (base pairs) and identity of the PCR fragments is shown to the left and right of the gel, respectively. C, genomic Ebf1fl/Δ control DNA. (D) Characterization of EBF1-deficient GC B cells. Splenic GC B cells (PNA+Fas+B220+CD19+; gray) of Cd23-Cre Ebf1fl/+ and Cd23-Cre Ebf1fl/– mice were analyzed for their cell size and expression of CD23 and CD38 at day 7 after immunization with SRBCs. Non–B cells (B220CD19; dashed line) and FO B cells (CD19+CD21intCD23hi; black line) served as controls. (E) Size of GCs in the spleen of Cd23-Cre Ebf1fl/− and Cd23-Cre Ebf1fl/+ mice at day 7 after immunization with SRBCs. Cryosections of the spleen were stained for peanut agglutinin (PNA, brown) and IgD (blue) expression as described in Materials and methods. The black scale bar corresponds to 500 µm. (F–H) GC B cells in the spleen of Cd23-Cre Ebf1fl/− mice and control Cd23-Cre Ebf1fl/+ littermates at day 14 after immunization with SRBCs, as shown by flow cytometry (F and G) and histological analysis (H). Statistical data (B and G) are shown with SEM and were analyzed by Student’s t test. *, P < 0.05; **, P < 0.01; ***, P < 0.001; and ****, P < 0.0001.
Figure 5.
Figure 5.
Impaired immune responses in the absence of EBF1. (A–E) NP-specific immune responses at day 14. Cd23-Cre Ebf1fl/+ mice (fl/+; gray bars) and Cd23-Cre Ebf1fl/– littermates (fl/−; black bars) were immunized with 4-hydroxy-3-nitrophenylacetyl-conjugated keyhole limpet hemocyanin (in Alum) and analyzed after 14 d by flow cytometric analysis of splenic B cells (A and B), immunohistochemical staining of the spleen (C), ELISpot assay (D), and ELISA (E). (D) The total number of anti–NP-IgG1 ASCs in the spleen or bone marrow (femur and tibia of the two hind legs) was determined by ELISpot assay using NP4-BSA– or NP23-BSA–coated plates for detecting cells secreting high-affinity or total anti–NP-IgG1 antibodies, respectively. (E) The serum titers of anti–NP-specific IgG1 antibodies were analyzed by ELISA using NP4-BSA– or NP23-BSA–coated plates for detecting high-affinity or total IgG1 antibodies, respectively. Bars, 500 µm. n, number of mice analyzed. Statistical data (B and D) are shown with SEM and were analyzed by Student’s t test. *, P < 0.05; **, P < 0.01.
Figure 6.
Figure 6.
B cell signaling defects in the absence of EBF1. (A) FO B cells were purified from the spleen of Cd23-Cre Ebf1fl/+ mice (black line; n = 2) and Cd23-Cre Ebf1fl/– mice (red line; n = 4) by MACS depletion of non–B cells with anti-PE beads after staining with PE-labeled TCRβ, CD4, CD8a, Mac1, and DX5 (Lin) antibodies. Intracellular Ca2+ fluxes were recorded as the fluorescence 405/485 nm ratio of Indo-1 emission after addition of anti-IgM antibody (arrow). (B) Partial rescue of activated EBF1-deficient B cells from apoptosis by CD45 stimulation. FO B cells from lymph nodes of Cd23-Cre Ebf1fl/– mice (open triangle and gray surface; n = 4) and Cd23-Cre Ebf1fl/+ littermates (black square and line; n = 4) were purified by MACS depletion of T cells with anti-PE beads after staining with PE-labeled TCRβ, CD4, and CD8a antibodies or were positively selected with anti-B220 MACS beads. The number of B cells and their Annexin V staining were determined by flow cytometry by gating on live cells at the indicated time points after anti-IgM stimulation. (C) FO B cells from lymph nodes of the indicated genotypes were positively selected with anti-B220 MACS beads and stained with CellTrace Violet reagent before stimulation with anti-IgM and IL-4 or with anti-CD40 and IL-4 for 4 d. The relative percentages of proliferating and IgG1+ B cells were determined by flow cytometric analysis. n = 3 (both genotypes) for anti-IgM plus IL-4 stimulation; n = 8 (Cd23-Cre Ebf1fl/+) and n = 10 (Cd23-Cre Ebf1fl/–) for anti-CD40 plus IL-4 stimulation. (D) FO B cells were purified from lymph nodes of Cd23-Cre Ebf1fl/– and Cd23-Cre Ebf1fl/+ mice, as described in B, before stimulation with anti-CD40 and IL-4 for up to 4 d. The number and Annexin V staining of live B cells were determined by flow cytometry. n = 4 for each genotype. (E) PCR genotyping of T cell–depleted B cells from lymph nodes of the indicated genotypes after 4 d of anti-CD40 plus IL-4 stimulation. C, genomic Ebf1fl/Δ control DNA.
Figure 7.
Figure 7.
Genome-wide analysis of regulated EBF1 target genes in FO B cells. (A) EBF1 binding at the Hck locus. EBF1-binding sites were identified by ChIP-sequencing in short-term cultured Rag2−/− pro–B cells and mature FO B cells, which were MACS-sorted from lymph nodes of WT C57BL/6 mice. DNase I hypersensitive (DHS) sites of FO B cells are additionally shown together with the exon–intron structure of the Hck gene and a scale bar indicated in kilobases. (B and C) Identification of EBF1 peaks and target genes in FO B cells compared with pro–B cells. EBF1 peaks (B) were identified by peak calling using a p-value of <10−10 and were assigned to target genes (C), if they were located from −50 kb upstream of the transcription start site (TSS) to +50 kb downstream of the transcription end site (TES). A second ChIP-seq experiment (Table S2) yielded similar results. (D) Identification of Ell3 and Scd1 as EBF1-activated genes in FO B cells by RNA-sequencing of polyA+ RNA from WT and Cd23-Cre Ebf1fl/− (Ebf1Δ/−) FO B cells (sorting strategy in Fig. S5, A and C). (E) Scatter plot of gene expression differences observed between WT and Ebf1Δ/− FO B cells. The normalized expression values of each gene in the two B cell types were plotted as reads per gene per million mapped sequence reads (RPM). Genes are highlighted in blue or red color, if they were expressed >10 RPMs and regulated at least fourfold between the two cell types. The data of one RNA-sequencing experiment for each cell type was analyzed (Table S2). (F–H) Expression of activated EBF1 target genes (F), as well as indirectly EBF1-activated (G) and EBF1-repressed (H) genes. The expression of each gene in WT (gray bar) and Ebf1Δ/− (black bar) FO B cells is shown as normalized expression value, which was determined as reads per kilobase of exon per million mapped sequence reads (RPKM). Different colors indicated genes of distinct functional categories.
Figure 8.
Figure 8.
Increased B-1 and reduced B-2 cell differentiation upon ectopic EBF1 expression. (A and B) B-1 (CD19+B220lo/–) and B-2 (CD19+B220+) cells were analyzed by flow cytometry in the bone marrow, spleen, lymph nodes, and peritoneum of R26CAEbf1/+ (white bars), Cd79a-Cre R26CAEbf1/+ (gray bars), and Cd23-Cre R26CAEbf1/+ (black bar) mice (A). Absolute cell numbers were determined for B-1 and B-2 cells in the bone marrow, spleen, and lymph nodes (B). n, number of mice analyzed. (C) Cell surface phenotype of B-1 and B-2 cells from the spleen of R26CAEbf1/+ mice (black line) and Cd79a-Cre R26CAEbf1/+ (gray) littermates. The B-1a (CD5+) and B-1b (CD5) B cells are indicated. (D) Flow cytometric identification of B-1a cells (CD5+CD43+CD19+B220lo/–) and B-1b cells (CD5CD43+CD19+B220lo/–) in the spleen of Cd79a-Cre R26CAEbf1/+ and control R26CAEbf1/+ littermates. The relative percentage of each B1 cell type is shown in the respective quadrant. (E–H) The relative percentages and absolute numbers of MZ and FO B cells (E and G), as well as GC B cells (F and H) were determined by flow cytometric analysis of the spleen from mice of the indicated genotypes. GC B cells were analyzed 7 d after immunization with SRBCs. Statistical data (B, G, and H) are shown with SEM and were analyzed by Student’s t test. *, P < 0.05; **, P < 0.01; ***, P < 0.001; and ****, P < 0.0001.
Figure 9.
Figure 9.
RNA-sequencing identified the EBF1-induced B-1a cells as bona fide B-1a cells. (A–C) Scatter plots of gene expression differences between WT and EBF1-overexpressing B-1a and FO B cells. Two independent RNA-sequencing experiments (Table S2) were performed for each FACS-sorted B-1a or FO B cell type isolated from the spleen of WT or Cd79a-Cre R26CAEbf1/+ mice (sorting strategy in Fig. S5, A and B). The average of the normalized expression values (RPM) for each gene were plotted to indicate the gene expression differences between the different cell types. Genes are highlighted in blue or red if they were called as differentially expressed genes with an adjusted p-value of <0.1. (D and E) Expression of B-1a cell–enriched (D) and FO B cell–enriched (E) transcripts, which were identified by comparison of WT B-1a and FO B cells (A). The expression of the indicated genes in B-1a and FO B cells of WT (gray bars) and Cd79a-Cre R26CAEbf1/+ (black bars) mice is shown as average of the normalized expression value (RPKM) together with the SEM.
Figure 10.
Figure 10.
Normal VH gene repertoire in EBF1-induced B-1a cells. Analysis of the rearranged and expressed VH gene repertoire of B-1a and FO B cells by RNA-sequencing. The abundance of the 76-nt-long sequence reads, which correspond to the RNA transcripts mapping to the variable (VH), diversity (DH), joining (JH), and constant (CH) gene segments of the Igh locus, are shown for B-1a and FO B cells of WT and Cd79a-Cre R26CAEbf1/+ mice. A schematic diagram of the Igh locus based on the C57BL/6 VH gene assembly (Johnston et al., 2006) indicates members of the distinct VH gene families in different colors. Arrows denote the positions of the VH11.2.53 and VH12.1.78 gene segments.

Similar articles

Cited by

References

    1. Ahearn J.M., Fischer M.B., Croix D., Goerg S., Ma M., Xia J., Zhou X., Howard R.G., Rothstein T.L., Carroll M.C. 1996. Disruption of the Cr2 locus results in a reduction in B-1a cells and in an impaired B cell response to T-dependent antigen. Immunity. 4:251–262 10.1016/S1074-7613(00)80433-1 - DOI - PubMed
    1. Allman D., Pillai S. 2008. Peripheral B cell subsets. Curr. Opin. Immunol. 20:149–157 10.1016/j.coi.2008.03.014 - DOI - PMC - PubMed
    1. Anders S., Huber W. 2010. Differential expression analysis for sequence count data. Genome Biol. 11:R106 10.1186/gb-2010-11-10-r106 - DOI - PMC - PubMed
    1. Bain G., Maandag E.C.R., Izon D.J., Amsen D., Kruisbeek A.M., Weintraub B.C., Krop I., Schlissel M.S., Feeney A.J., van Roon M., et al. 1994. E2A proteins are required for proper B cell development and initiation of immunoglobulin gene rearrangements. Cell. 79:885–892 10.1016/0092-8674(94)90077-9 - DOI - PubMed
    1. Baumgarth N. 2011. The double life of a B-1 cell: self-reactivity selects for protective effector functions. Nat. Rev. Immunol. 11:34–46 10.1038/nri2901 - DOI - PubMed

Publication types