. 2012 Apr 9;209(4):807-17.
doi: 10.1084/jem.20111202. Epub 2012 Apr 2.

ATF3 protects against atherosclerosis by suppressing 25-hydroxycholesterol-induced lipid body formation

Affiliations

ATF3 protects against atherosclerosis by suppressing 25-hydroxycholesterol-induced lipid body formation

Elizabeth S Gold et al. J Exp Med. .

Abstract

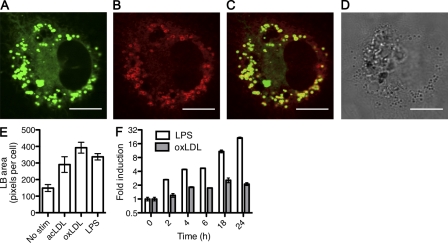
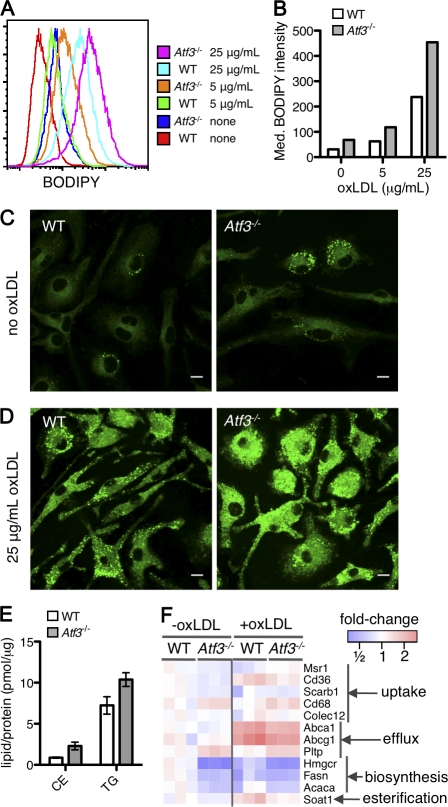
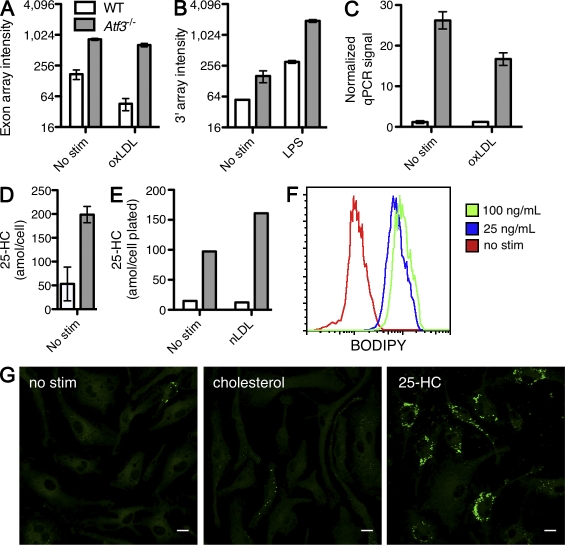
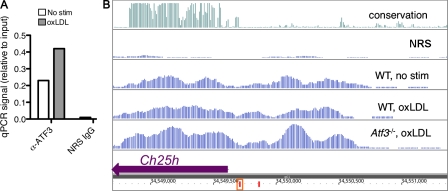
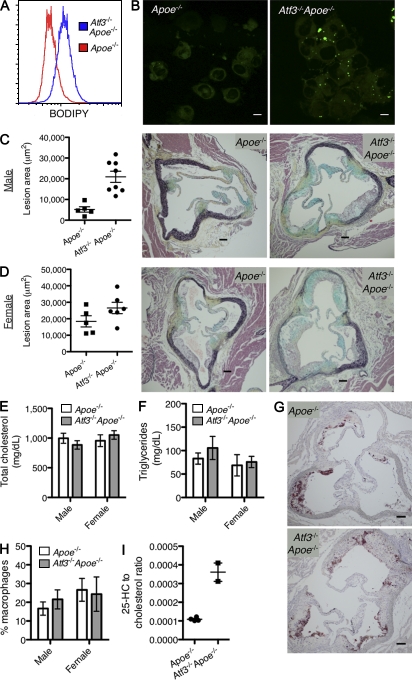
Atherosclerosis is a chronic inflammatory disease characterized by the accumulation of lipid-loaded macrophages in the arterial wall. We demonstrate that macrophage lipid body formation can be induced by modified lipoproteins or by inflammatory Toll-like receptor agonists. We used an unbiased approach to study the overlap in these pathways to identify regulators that control foam cell formation and atherogenesis. An analysis method integrating epigenomic and transcriptomic datasets with a transcription factor (TF) binding site prediction algorithm suggested that the TF ATF3 may regulate macrophage foam cell formation. Indeed, we found that deletion of this TF results in increased lipid body accumulation, and that ATF3 directly regulates transcription of the gene encoding cholesterol 25-hydroxylase. We further showed that production of 25-hydroxycholesterol (25-HC) promotes macrophage foam cell formation. Finally, deletion of ATF3 in Apoe(-/-) mice led to in vivo increases in foam cell formation, aortic 25-HC levels, and disease progression. These results define a previously unknown role for ATF3 in controlling macrophage lipid metabolism and demonstrate that ATF3 is a key intersection point for lipid metabolic and inflammatory pathways in these cells.


Figures

Figure 1.
Figure 1.
Endotoxin- and lipoprotein-induced neutral lipid accumulations colocalize with lipid body marker ADRP. (A–C) WT BMDMs were stimulated with 5 µg/ml acetylated LDL (acLDL) for 4 h, stained for neutral lipids (BODIPY 493/503) and immunofluorescence-stained for the lipid body marker protein ADRP (adipose differentiation related protein, also known as PLIN2). ADRP detection was using an Alexa Fluor 633–conjugated secondary antibody. (For a BODIPY image of unstimulated macrophages, see Fig. 2 C). (A) BODIPY fluorescence shown in green. (B) Alexa Fluor 633 (ADRP) fluorescence shown in red. (C) Overlay. (D) Phase-contrast bright-field image showing refractile droplets that colocalize with BODIPY- and ADRP-positive lipid bodies. Images shown are from a representative of two independent experiments. Bars, 10 µm. (E) Quantitation of mean area per cell, occupied by BODIPY-positive lipid bodies in stacked confocal epifluorescence micrographs of WT BMDM stimulated for 18 h with 5 µg/ml acLDL, 5 µg/ml oxLDL, or 100 ng/ml LPS. Error bars represent the mean ± SEM (five fields per condition) from a representative experiment (two independent experiments performed). (F) Time course of mRNA levels of Atf3 in WT BMDM treated with 25 µg/ml oxLDL or 10 ng/ml LPS, as measured by qPCR (normalized to Eef1a1). Error bars represent the mean ± SEM (two independent biological replicates).
Figure 2.
Figure 2.
Atf3−/− macrophages have higher neutral lipid content than WT macrophages in the presence (or absence) of oxLDL. (A) Flow cytometry fluorescence histograms of BODIPY-stained BMDM of the indicated genotypes, incubated for 24 h with oxLDL at the indicated concentrations. (B) Atf3−/− and WT BMDM were incubated for 24 h in medium containing 0, 5, or 25 µg/ml oxLDL. BODIPY-stained median fluorescence levels are shown. (C and D) Confocal epifluorescence micrographs of BODIPY-stained BMDM of the indicated genotypes incubated without (C) or with (D) 25 µg/ml oxLDL for 24 h. Bars, 10 µm. Images shown are from a representative of two independent experiments. (E) Quantitative assay for cellular CE and TG, normalized to total protein content, in BMDM of the indicated genotypes. Error bars represent mean ± SEM (three independent biological replicates). (F) Heat map showing relative transcript levels for 10 genes based on oligonucleotide microarray hybridization (exon array). Each column represents a single biological replicate for BMDM of the indicated genotype and condition (no oxLDL or 25 µg/ml oxLDL for 24 h), and each row represents a gene. Color indicates expression level relative to the gene’s mean expression level in WT unstimulated BMDM. As shown in the heat map, microarray profiling of each genotype and condition was performed in three biological replicates.
Figure 3.
Figure 3.
Ch25h transcript level and 25-HC are up-regulated in Atf3−/− versus WT macrophages. (A) Ch25h transcript levels in BMDM incubated with media alone or with 25 µg/ml oxLDL for 24 h, measured by exon microarray. Error bars represent the mean ± SEM (n = 3). (B) Ch25h transcript levels in BMDM incubated with media alone or with 10 ng/ml LPS for 4 h, measured by 3′ gene expression microarray. Error bars represent the mean ± SEM (n = 3 experiments for each bar, except for LPS Atf3−/−, for which n = 2). (C) Relative transcript levels of Ch25h in BMDM of the indicated genotypes incubated with no oxLDL or with 25 µg/ml oxLDL for 24 h, as measured by qPCR (normalized to Gapdh). Error bars represent the mean ± SEM (n = 3). (D) Levels of free 25-HC in cell extracts from BMDM of the indicated genotypes, measured by mass spectrometry with absolute quantitation. Error bars represent the mean ± SEM (n = 2). (E) Levels of free 25-HC in medium conditioned with BMDM of the indicated genotypes and conditions (nLDL = native LDL, 25 µg/ml) for 24 h, measured by mass spectrometry. (F) BODIPY fluorescence histograms of BMDM treated with the indicated concentrations of 25-HC for 4 h. Data shown are from a representative of two independent experiments. (G) BODIPY fluorescence micrographs of WT BMDM grown for 24 h in medium alone, 25 ng/ml cholesterol, or 25 ng/ml 25-HC. Bars, 10 µm. Images shown are from a representative of three independent experiments.
Figure 4.
Figure 4.
ATF3 binds the promoter of Ch25h and histone acetylation at the Ch25h promoter is significantly increased in Atf3−/− versus WT macrophages. (A) ChIP-qPCR signal, relative to input chromatin, for WT BMDM under the indicated stimulus conditions and using the indicated antibodies (α-ATF3 or IgG from normal rabbit serum, NRS). (B) View of the Ch25h promoter region on mouse chromosome 19, showing histone acetylation ChIP-seq data, CREB/ATF binding elements, and conservation data. ChIP-seq data tracks (vertical blue bars at 10 bp intervals) are from BMDM of the indicated genotypes and conditions (oxLDL, 25 µg/ml for 24 h) immunoprecipitated with an antibody for acetyl-H4 or with NRS IgG as a negative control. All ChIP-seq tracks are in tags per million and are on the same vertical scale. The conservation data track (vertical green bars at 10 bp intervals, top row) are PHAST 30-way vertebrate conservation scores from genomic sequence, averaged over the flanking 10 bp. Red vertical bars denote sequence matches to the CREB/ATF TF binding site motif. The orange square indicates the locus that was assayed for ATF3 binding, by ChIP-qPCR. The Ch25h gene is shown at the bottom of the diagram (thick purple bar); the direction of transcription is to the left.
Figure 5.
Figure 5.
Loss of ATF3 increases neutral lipid content and lipid body formation in macrophages from hypercholesterolemic mice, increases severity of atherosclerosis and increases the level of 25-HC in aortic tissue. Mice of the indicated genotypes were maintained on a high-fat diet for 8 wk. (A) Flow cytometry fluorescence histograms for BODIPY-stained resident peritoneal macrophages (B) Confocal epifluorescence micrographs of Nile red–stained resident peritoneal macrophages. Bars, 10 µm. (C and D) Left panels show aortic root lesion areas in male (C) and female (D) mice. Long horizontal bar denotes mean, and the error bars denote SEM (each data mark denotes an individual animal). Middle and right panels show representative micrographs of aortic root sections, after Movat’s pentachrome staining. Bars, 100 µm. (E) Total cholesterol and (F) TG measurements from serum. Error bars denote mean ± SEM (n = 6 for males, n = 4 for Apoe−/− female, and n = 5 for Atf3−/−Apoe−/− female). (G) Oil red O– and hematoxylin-stained aortic root micrographs. Images shown are representative of two independent biological replicates. Bars, 100 µm. (H) Percentage of lesion section area staining positive for the macrophage marker Mac-2, by immunohistochemistry. Error bars represent the mean ± SEM (numbers of animals same as for cholesterol). (I) Ratio of 25-HC to cholesterol level, measured by mass spectrometry with absolute quantitation, in sterols isolated from homogenized aortas (P < 0.01, 3.3-fold increase between Apoe−/− and Atf3−/−Apoe−/−). The long horizontal bar denotes the mean, and the short bars denote the SEM (each data mark denotes an individual aorta; n = 2 for Atf3−/−Apoe−/−, one female and one male; n = 4 for Apoe−/−, two females and two males). Data shown are representative of two independent experiments.

References

    1. Bauman D.R., Bitmansour A.D., McDonald J.G., Thompson B.M., Liang G., Russell D.W. 2009. 25-Hydroxycholesterol secreted by macrophages in response to Toll-like receptor activation suppresses immunoglobulin A production. Proc. Natl. Acad. Sci. USA. 106:16764–16769 10.1073/pnas.0909142106 - DOI - PMC - PubMed
    1. Benjamini Y., Hochberg Y. 1995. Controlling the false discovery rate: a practical and powerful approach to multiple testing. J.R. Stat. Soc. Ser. B. 57:289–300
    1. Bozza P.T., Melo R.C., Bandeira-Melo C. 2007. Leukocyte lipid bodies regulation and function: contribution to allergy and host defense. Pharmacol. Ther. 113:30–49 10.1016/j.pharmthera.2006.06.006 - DOI - PubMed
    1. Brown M.S., Dana S.E., Goldstein J.L. 1975. Cholesterol ester formation in cultured human fibroblasts. Stimulation by oxygenated sterols. J. Biol. Chem. 250:4025–4027 - PubMed
    1. Caligiuri G., Nicoletti A., Zhou X., Törnberg I., Hansson G.K. 1999. Effects of sex and age on atherosclerosis and autoimmunity in apoE-deficient mice. Atherosclerosis. 145:301–308 10.1016/S0021-9150(99)00081-7 - DOI - PubMed

Publication types