. 2012 Jun;61(6):1500-8.
doi: 10.2337/db11-0264. Epub 2012 Apr 3.

Children with islet autoimmunity and enterovirus infection demonstrate a distinct cytokine profile

Affiliations

Children with islet autoimmunity and enterovirus infection demonstrate a distinct cytokine profile

Wing-Chi G Yeung et al. Diabetes. 2012 Jun.

Abstract

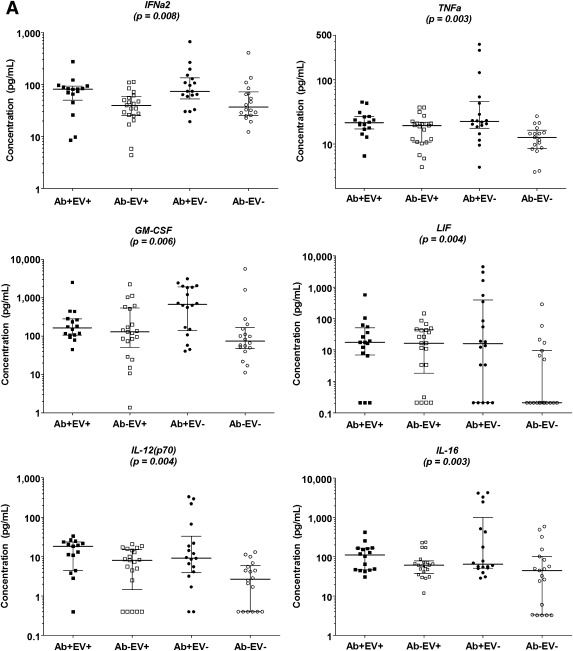
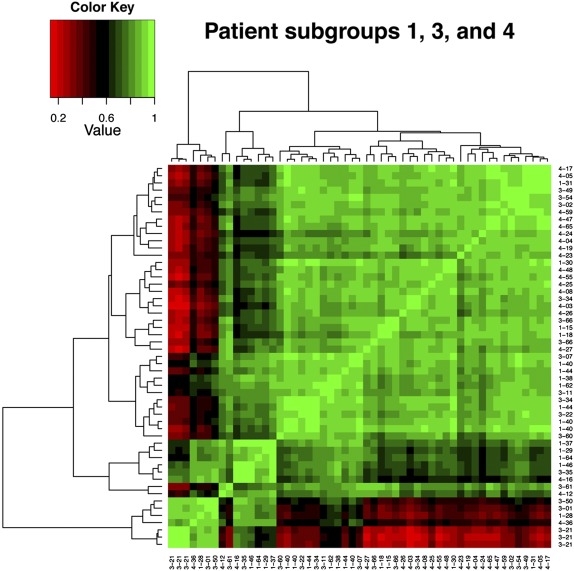
Cytokines are upregulated in prediabetes, but their relationship with Enterovirus (EV) infection and development of islet autoimmunity is unknown. Cytokines (n = 65) were measured using Luminex xMAP technology in a nested case-control study of 67 children with a first-degree relative with type 1 diabetes: 27 with islet autoantibodies (Ab(+)) and 40 age-matched persistently autoantibody negative (Ab(-)) control subjects. Of 74 samples, 37 (50%) were EV-PCR(+) in plasma and/or stool (EV(+)) and the remainder were negative for EV and other viruses (EV(-)). Fifteen cytokines, chemokines, and growth factors were elevated (P ≤ 0.01) in Ab(+) versus Ab(-) children (interleukin [IL]-1β, IL-5, IL-7, IL-12(p70), IL-16, IL-17, IL-20, IL-21, IL-28A, tumor necrosis factor-α, chemokine C-C motif ligand [CCL]13, CCL26, chemokine C-X-C motif ligand 5, granulocyte-macrophage colony-stimulating factor, and thrombopoietin); most have proinflammatory effects. In EV(+) versus EV(-) children, IL-10 was higher (P = 0.005), while IL-21 was lower (P = 0.008). Cytokine levels did not differ between Ab(+)EV(+) and Ab(+)EV(-) children. Heat maps demonstrated clustering of some proinflammatory cytokines in Ab(+) children, suggesting they are coordinately regulated. In conclusion, children with islet autoimmunity demonstrate higher levels of multiple cytokines, consistent with an active inflammatory process in the prediabetic state, which is unrelated to coincident EV infection. Apart from differences in IL-10 and IL-21, EV infection was not associated with a specific cytokine profile.


Figures

FIG. 1.
FIG. 1.
A: Proinflammatory cytokine concentrations across the four subgroups of islet Ab and/or EV infection. B: Pro- and anti-inflammatory cytokine, chemokine, and growth factor concentrations across the four subgroups of Ab and/or EV infection. Statistical significance defined as P ≤ 0.01.
FIG. 1.
FIG. 1.
A: Proinflammatory cytokine concentrations across the four subgroups of islet Ab and/or EV infection. B: Pro- and anti-inflammatory cytokine, chemokine, and growth factor concentrations across the four subgroups of Ab and/or EV infection. Statistical significance defined as P ≤ 0.01.
FIG. 2.
FIG. 2.
Heat map and cluster analysis of cytokines in Ab+ children. The heat map is a visual representation of the correlation values between each pair of cytokines, where the corresponding pair of cytokines are labeled at each row and column of the matrix. The matrix is symmetrical about the bottom-left to upper-right diagonal axis. Green represents positive correlation, black represents low correlation, and red represents negative correlation, as shown in the color key. Cytokines with highly correlated expression profiles are grouped together using hierarchical clustering, and the clusters are represented in the dendrogram. Many proinflammatory cytokines grouped together (e.g., the top cluster contains IFN-α2, IL-1β, IL-7, IL-15, IL-33, and LIF), as did many chemokines; however, anti-inflammatory cytokines and growth factors were distributed across different groups.
FIG. 3.
FIG. 3.
Heat map and cluster analysis of cytokines in clinical samples. The heat map is a visual representation of the correlation values between each pair of samples denoted by the corresponding row and columns of the matrix. The label represents the subgroup (1: Ab+/EV+; 3: Ab+/EV; 4: Ab/EV) and sample number; samples with EV infection (Ab/EV+) were excluded. The matrix is symmetrical about the bottom-left to upper-right diagonal axis. Green represents positive correlation, black represents low correlation, and red represents negative correlation, as shown in the color key. Samples with correlated cytokine profiles are grouped together by hierarchical clustering, and the clusters are represented in the dendrogram. The figure shows that cytokine profiles have some capacity to distinguish Ab+ vs. Ab children but do not differentiate Ab+ cases based on EV infection status.

Similar articles

Cited by

References

    1. Rowe PA, Campbell-Thompson ML, Schatz DA, Atkinson MA. The pancreas in human type 1 diabetes. Semin Immunopathol 2011;33:29–43 - PMC - PubMed
    1. Eizirik DL, Colli ML, Ortis F. The role of inflammation in insulitis and beta-cell loss in type 1 diabetes. Nat Rev Endocrinol 2009;5:219–226 - PubMed
    1. Hanifi-Moghaddam P, Kappler S, Seissler J, et al. Altered chemokine levels in individuals at risk of type 1 diabetes mellitus. Diabet Med 2006;23:156–163 - PubMed
    1. Stechova K, Bohmova K, Vrabelova Z, et al. High T-helper-1 cytokines but low T-helper-3 cytokines, inflammatory cytokines and chemokines in children with high risk of developing type 1 diabetes. Diabetes Metab Res Rev 2007;23:462–471 - PubMed
    1. Erlich H, Valdes AM, Noble J, et al. Type 1 Diabetes Genetics Consortium HLA DR-DQ haplotypes and genotypes and type 1 diabetes risk: analysis of the type 1 diabetes genetics consortium families. Diabetes 2008;57:1084–1092 - PMC - PubMed

Publication types