

Critical role of TRPC1-mediated Ca²⁺ entry in decidualization of human endometrial stromal cells
- PMID: 22474110
- PMCID: PMC5417103
- DOI: 10.1210/me.2011-1259
Critical role of TRPC1-mediated Ca²⁺ entry in decidualization of human endometrial stromal cells
Abstract
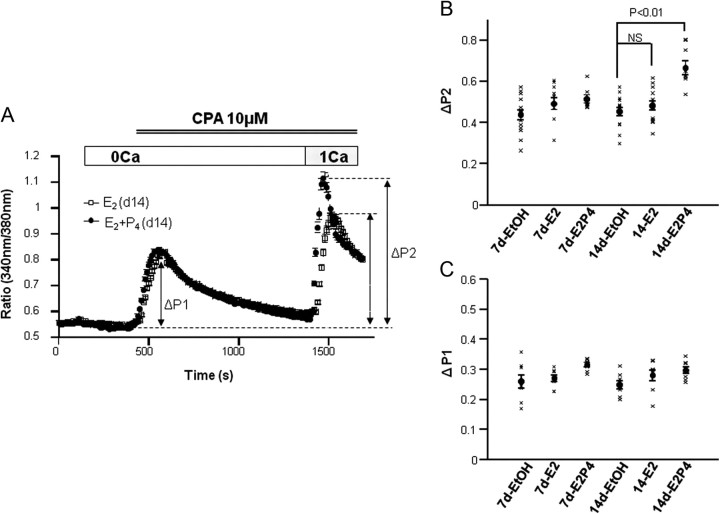
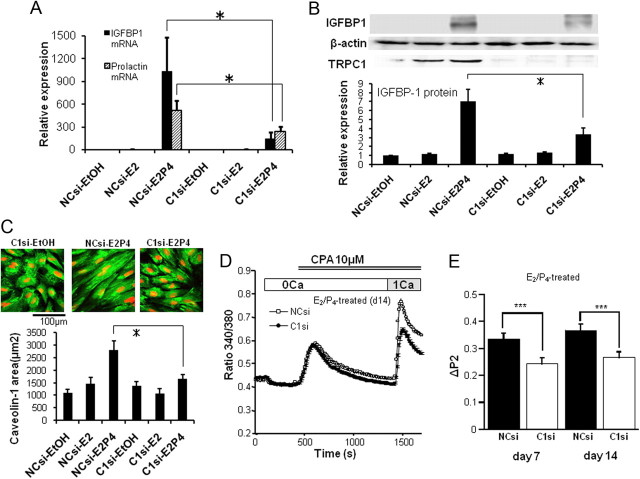
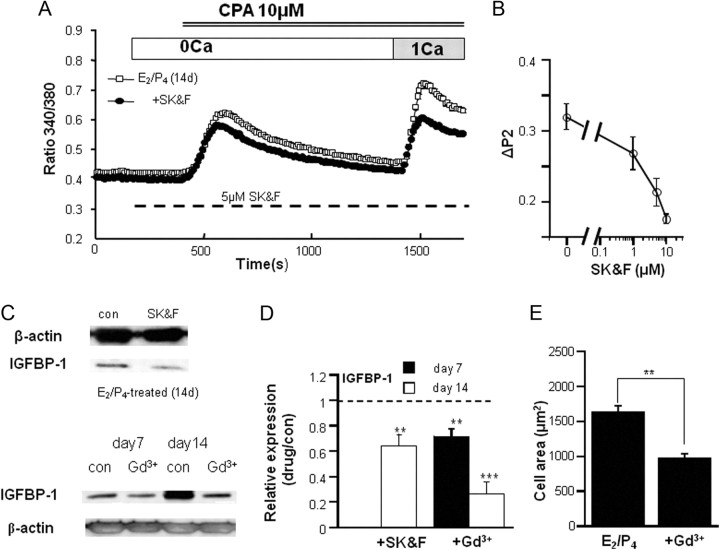
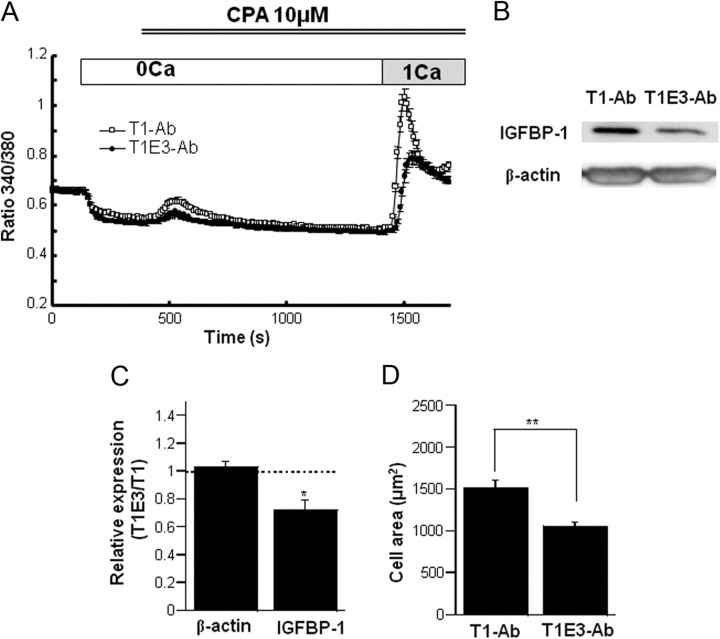
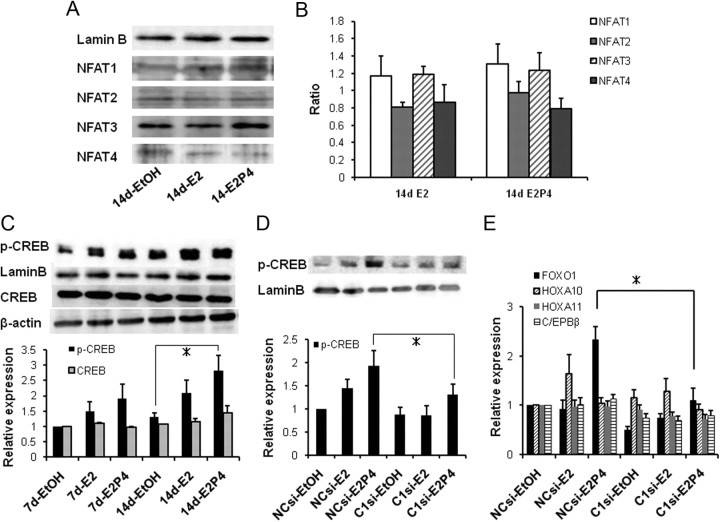
Decidualization is an ovarian steroid-induced remodeling/differentiation process of uterus essential for embryo implantation and placentation. Here, we investigated the possible involvement of enhanced Ca²⁺ dynamics in the decidualization process in human endometrial stromal cells (hESC) in its connection with a recently emerging nonvoltage-gated Ca²⁺ entry channel superfamily, the transient receptor potential (TRP) protein. Combined application of 17β-estradiol (E₂) (10 nM) and progesterone (P₄) (1 μM) for 7-14 d resulted in morphological changes of hESC characteristic of decidualization (i.e. cell size increase), whereas sole application of E₂ exerted little effects. A 7- to 14-d E₂/P₄ treatment greatly increased the expression level of decidualization markers IGF binding protein-1 (IGFBP-1) and prolactin and also up-regulated the expression of TRPC1, a canonical TRP subfamily member that has been implicated in store-operated Ca²⁺ influx (SOC) in other cell types. In parallel with this up-regulation, SOC activity in hESC, the nuclear translocation of phosphorylated cAMP responsive element binding protein (p-CREB) and the expression of Forkhead box protein 01 were enhanced significantly. Small interfering RNA knockdown of TRPC1 counteracted the E₂/P₄-induced up-regulation of IGFBP-1 and prolactin and enhancement of SOC activity together with the inhibition of hESC size increase, p-CREB nuclear translocation, and FOXO1 up-regulation. Coadministration of SOC inhibitors SK&F96365 or Gd³⁺ with E₂/P₄ also suppressed the up-regulation of IGFBP-1 and hESC size increase. Similar inhibitory effects were observed with extracellularly applied TRPC1 extracellular loop 3-directed antibody, which is known to bind a near-pore domain of TRPC1 channel and block its Ca²⁺ transporting activity. These results strongly suggest that up-regulation of TRPC1 protein and consequent enhancement of SOC-mediated Ca²⁺ influx may serve as a crucial step for the decidualization process of hESC probably via p-CREB-dependent transcriptional activity associated with FOXO1 activation.
Figures

Similar articles
-
Regulation of decidualization in human endometrial stromal cells through exchange protein directly activated by cyclic AMP (Epac).Placenta. 2013 Mar;34(3):212-21. doi: 10.1016/j.placenta.2012.12.017. Epub 2013 Jan 22. Placenta. 2013. PMID: 23352189
-
Growth regulation by estrogen in breast cancer 1 (GREB1) is a novel progesterone-responsive gene required for human endometrial stromal decidualization.Mol Hum Reprod. 2017 Sep 1;23(9):646-653. doi: 10.1093/molehr/gax045. Mol Hum Reprod. 2017. PMID: 28911214 Free PMC article.
-
Evaluation of human first trimester decidual and telomerase-transformed endometrial stromal cells as model systems of in vitro decidualization.Reprod Biol Endocrinol. 2011 Dec 7;9:155. doi: 10.1186/1477-7827-9-155. Reprod Biol Endocrinol. 2011. PMID: 22151839 Free PMC article.
-
The distal upstream region of insulin-like growth factor-binding protein-1 enhances its expression in endometrial stromal cells during decidualization.J Biol Chem. 2018 Apr 6;293(14):5270-5280. doi: 10.1074/jbc.RA117.000234. Epub 2018 Feb 16. J Biol Chem. 2018. PMID: 29453285 Free PMC article.
-
Retinoic acid suppresses in-vitro decidualization of human endometrial stromal cells.Mol Hum Reprod. 1996 Mar;2(3):185-93. doi: 10.1093/molehr/2.3.185. Mol Hum Reprod. 1996. PMID: 9238678
Cited by
-
Regulatory Action of Calcium Ion on Cyclic AMP-Enhanced Expression of Implantation-Related Factors in Human Endometrial Cells.PLoS One. 2015 Jul 10;10(7):e0132017. doi: 10.1371/journal.pone.0132017. eCollection 2015. PLoS One. 2015. PMID: 26161798 Free PMC article.
-
Functional Expression of TRP Ion Channels in Endometrial Stromal Cells of Endometriosis Patients.Int J Mol Sci. 2018 Aug 21;19(9):2467. doi: 10.3390/ijms19092467. Int J Mol Sci. 2018. PMID: 30134548 Free PMC article.
-
Deletion of Arid1a in Reproductive Tract Mesenchymal Cells Reduces Fertility in Female Mice.Biol Reprod. 2016 Apr;94(4):93. doi: 10.1095/biolreprod.115.133637. Epub 2016 Mar 9. Biol Reprod. 2016. PMID: 26962117 Free PMC article.
-
Involvement of TRPC channels in lung cancer cell differentiation and the correlation analysis in human non-small cell lung cancer.PLoS One. 2013 Jun 28;8(6):e67637. doi: 10.1371/journal.pone.0067637. Print 2013. PLoS One. 2013. PMID: 23840757 Free PMC article.
-
Diverse roles of prostaglandins in blastocyst implantation.ScientificWorldJournal. 2014 Jan 27;2014:968141. doi: 10.1155/2014/968141. eCollection 2014. ScientificWorldJournal. 2014. PMID: 24616654 Free PMC article. Review.
References
-
- Gellersen B , Brosens IA , Brosens JJ. 2007. Decidualization of the human endometrium: mechanisms, functions, and clinical perspectives. Semin Reprod Med 25:445–453 - PubMed
-
- Tseng L , Gao JG , Chen R , Zhu HH , Mazella J , Powell DR. 1992. Effect of progestin, antiprogestin, and relaxin on the accumulation of prolactin and insulin-like growth factor-binding protein-1 messenger ribonucleic acid in human endometrial stromal cells. Biol Reprod 47:441–450 - PubMed
-
- Lockwood CJ , Nemerson Y , Guller S , Krikun G , Alvarez M , Hausknecht V , Gurpide E , Schatz F. 1993. Progestational regulation of human endometrial stromal cell tissue factor expression during decidualization. J Clin Endocrinol Metab 76:231–236 - PubMed
-
- Sakakibara H , Taga M , Saji M , Kida H , Minaguchi H. 1994. Gene expression of epidermal growth factor in human endometrium during decidualization. J Clin Endocrinol Metab 79:223–226 - PubMed
-
- Dimitriadis E , White CA , Jones RL , Salamonsen LA. 2005. Cytokines, chemokines and growth factors in endometrium related to implantation. Hum Reprod Update 11:613–630 - PubMed
Publication types
MeSH terms
Substances
LinkOut - more resources
Full Text Sources
Research Materials
Miscellaneous
