Profound hypoglycemia in starved, ghrelin-deficient mice is caused by decreased gluconeogenesis and reversed by lactate or fatty acids
- PMID: 22474325
- PMCID: PMC3365699
- DOI: 10.1074/jbc.M112.358051
Profound hypoglycemia in starved, ghrelin-deficient mice is caused by decreased gluconeogenesis and reversed by lactate or fatty acids
Abstract
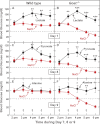
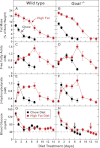
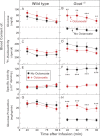
When mice are subjected to 7-day calorie restriction (40% of normal food intake), body fat disappears, but blood glucose is maintained as long as the animals produce ghrelin, an octanoylated peptide that stimulates growth hormone secretion. Mice can be rendered ghrelin-deficient by knock-out of the gene encoding either ghrelin O-acyltransferase, which attaches the required octanoate, or ghrelin itself. Calorie-restricted, fat-depleted ghrelin O-acyltransferase or ghrelin knock-out mice fail to show the normal increase in growth hormone and become profoundly hypoglycemic when fasted for 18-23 h. Glucose production in Goat(-/-) mice was reduced by 60% when compared with similarly treated WT mice. Plasma lactate and pyruvate were also low. Injection of lactate, pyruvate, alanine, or a fatty acid restored blood glucose in Goat(-/-) mice. Thus, when body fat is reduced by calorie restriction, ghrelin stimulates growth hormone secretion, which allows maintenance of glucose production, even when food intake is eliminated. In humans with anorexia nervosa or kwashiorkor, ghrelin and growth hormone are known to be elevated, just as they are in fat-depleted mice. We suggest that these two hormones prolong survival in starved humans as they do in mice.
Figures


Similar articles
-
Unexpected role for IGF-1 in starvation: Maintenance of blood glucose.Proc Natl Acad Sci U S A. 2022 Aug 9;119(32):e2208855119. doi: 10.1073/pnas.2208855119. Epub 2022 Aug 1. Proc Natl Acad Sci U S A. 2022. PMID: 35914126 Free PMC article.
-
Surviving starvation: essential role of the ghrelin-growth hormone axis.Cold Spring Harb Symp Quant Biol. 2011;76:121-7. doi: 10.1101/sqb.2011.76.010447. Epub 2011 Jul 22. Cold Spring Harb Symp Quant Biol. 2011. PMID: 21785007 Review.
-
Reduced autophagy in livers of fasted, fat-depleted, ghrelin-deficient mice: reversal by growth hormone.Proc Natl Acad Sci U S A. 2015 Jan 27;112(4):1226-31. doi: 10.1073/pnas.1423643112. Epub 2015 Jan 12. Proc Natl Acad Sci U S A. 2015. PMID: 25583513 Free PMC article.
-
Ghrelin O-acyltransferase (GOAT) is essential for growth hormone-mediated survival of calorie-restricted mice.Proc Natl Acad Sci U S A. 2010 Apr 20;107(16):7467-72. doi: 10.1073/pnas.1002271107. Epub 2010 Mar 15. Proc Natl Acad Sci U S A. 2010. PMID: 20231469 Free PMC article.
-
Ghrelin acylation and metabolic control.Peptides. 2011 Nov;32(11):2301-8. doi: 10.1016/j.peptides.2011.08.020. Epub 2011 Aug 27. Peptides. 2011. PMID: 21893140 Review.
Cited by
-
Metabolic profiling in Prader-Willi syndrome and nonsyndromic obesity: sex differences and the role of growth hormone.Clin Endocrinol (Oxf). 2015 Dec;83(6):797-805. doi: 10.1111/cen.12766. Epub 2015 Apr 1. Clin Endocrinol (Oxf). 2015. PMID: 25736874 Free PMC article.
-
Ghrelin regulating liver activity and its potential effects on liver fibrosis and Echinococcosis.Front Cell Infect Microbiol. 2024 Jan 8;13:1324134. doi: 10.3389/fcimb.2023.1324134. eCollection 2023. Front Cell Infect Microbiol. 2024. PMID: 38259969 Free PMC article. Review.
-
Ghrelin-induced Food Intake, but not GH Secretion, Requires the Expression of the GH Receptor in the Brain of Male Mice.Endocrinology. 2021 Jul 1;162(7):bqab097. doi: 10.1210/endocr/bqab097. Endocrinology. 2021. PMID: 33972988 Free PMC article.
-
Acyl-ghrelin Is Permissive for the Normal Counterregulatory Response to Insulin-Induced Hypoglycemia.Diabetes. 2020 Feb;69(2):228-237. doi: 10.2337/db19-0438. Epub 2019 Nov 4. Diabetes. 2020. PMID: 31685528 Free PMC article.
-
The GPCR accessory protein MRAP2 regulates both biased signaling and constitutive activity of the ghrelin receptor GHSR1a.Sci Signal. 2020 Jan 7;13(613):eaax4569. doi: 10.1126/scisignal.aax4569. Sci Signal. 2020. PMID: 31911434 Free PMC article.
References
-
- Svedberg P. (2011) How many people are malnourished? Annu. Rev. Nutr. 31, 263–283 - PubMed
-
- Bryce J., Boschi-Pinto C., Shibuya K., Black R. E., and the WHO Child Health Epidemiology Reference Group (2005) WHO estimates of the causes of death in children. Lancet 365, 1147–1152 - PubMed
-
- Cahill G. F., Jr. (2006) Fuel metabolism in starvation. Annu. Rev. Nutr. 26, 1–22 - PubMed
-
- Zhao T. J., Liang G., Li R. L., Xie X., Sleeman M. W., Murphy A. J., Valenzuela D. M., Yancopoulos G. D., Goldstein J. L., Brown M. S. (2010) Ghrelin O-acyltransferase (GOAT) is essential for growth hormone-mediated survival of calorie-restricted mice. Proc. Natl. Acad. Sci. U.S.A. 107, 7467–7472 - PMC - PubMed
Publication types
MeSH terms
Substances
Grants and funding
LinkOut - more resources
Full Text Sources
Other Literature Sources
Medical
Molecular Biology Databases

